Fig. 3.
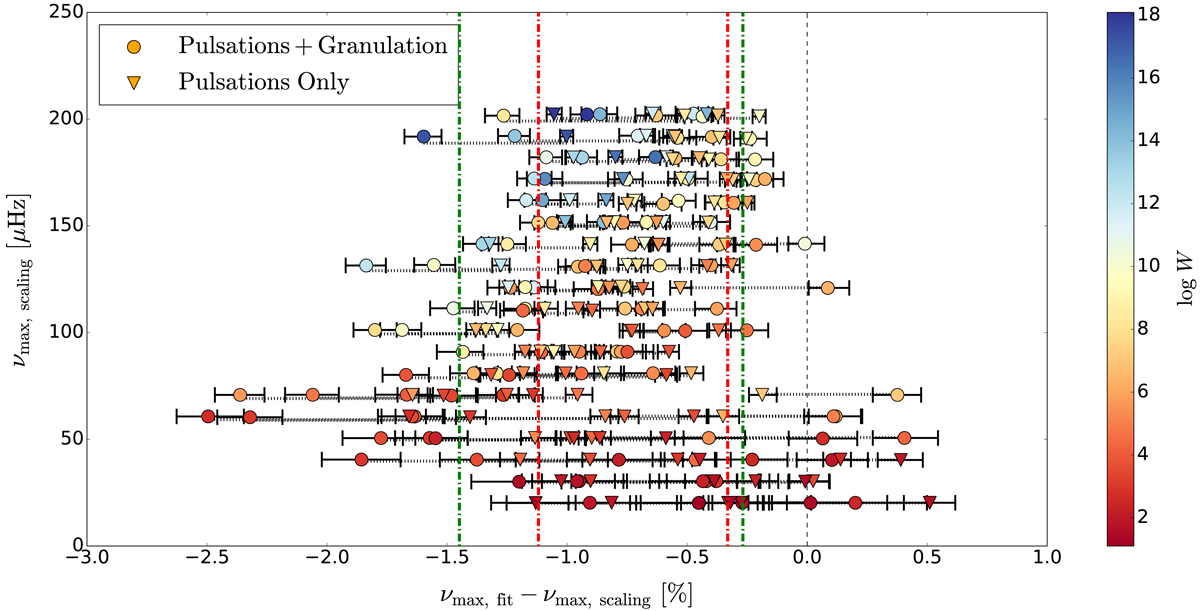
Comparison of the νmax values extracted from our synthetic single-RG PSDs. We tested synthetic light curves containing only a pulsational signal (triangles), and both a pulsational and a granulation signal (circles). The vertical axis corresponds to the scaling relation (νmax, scaling) input values of the light curves, and the horizontal axis corresponds to the percentage difference between the fit (νmax, fit) and the scaling relation (νmax, scaling) values. The vertical dashed line represents the zero-point of the difference between νmax, fit and νmax, scaling. The dash-dotted lines represent the 1σ level about the mean scatter of the datapoints corresponding to the pulsational signal (red), and both the pulsational and granulation signals (green). The horizontal dotted lines connect the datapoints corresponding to the same RG model. The error bars correspond to the 68% Bayesian credible intervals of the marginalised posterior distributions of the fit parameters. The symbols are colour-coded according the logarithm of the white noise (log W) included in the light curves and PSDs.
Current usage metrics show cumulative count of Article Views (full-text article views including HTML views, PDF and ePub downloads, according to the available data) and Abstracts Views on Vision4Press platform.
Data correspond to usage on the plateform after 2015. The current usage metrics is available 48-96 hours after online publication and is updated daily on week days.
Initial download of the metrics may take a while.