Free Access
Fig. D.3.
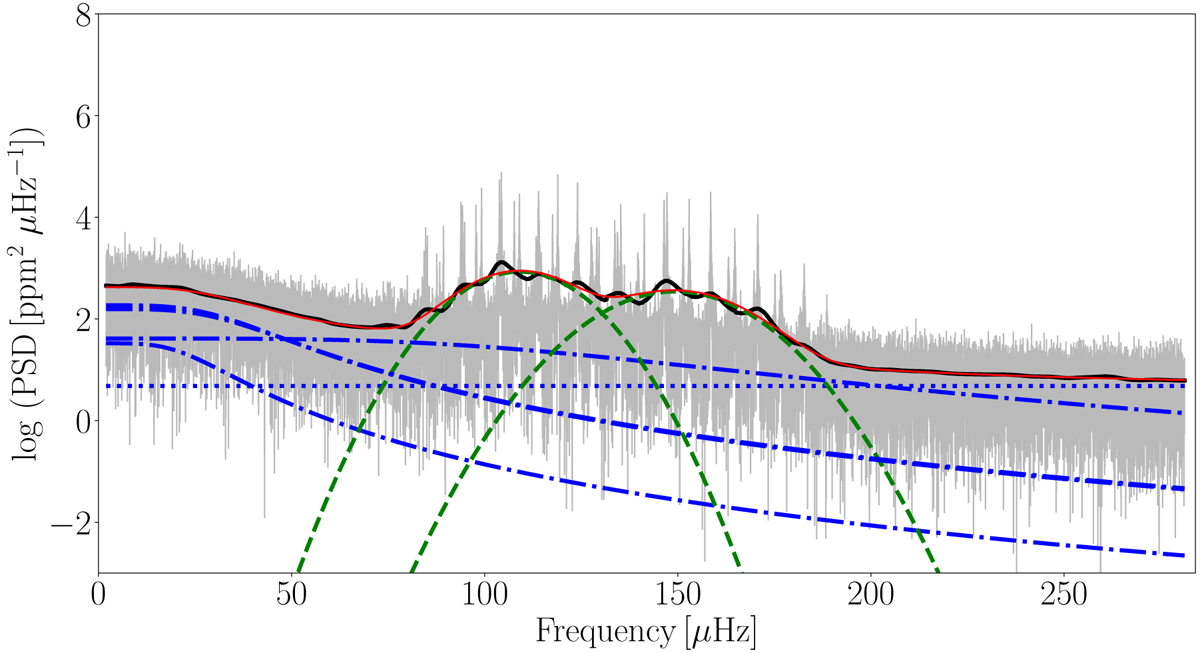
Example of a RG-binary PSD fit where both components, with very similar νmax values, are pulsating. Here we use four super-Lorentzians to fit the granulation signal in the PSD. The grey, black, red, green and blue lines (both dashed and dotted) represent the same signals as in Fig. D.2.
Current usage metrics show cumulative count of Article Views (full-text article views including HTML views, PDF and ePub downloads, according to the available data) and Abstracts Views on Vision4Press platform.
Data correspond to usage on the plateform after 2015. The current usage metrics is available 48-96 hours after online publication and is updated daily on week days.
Initial download of the metrics may take a while.