Fig. D.1.
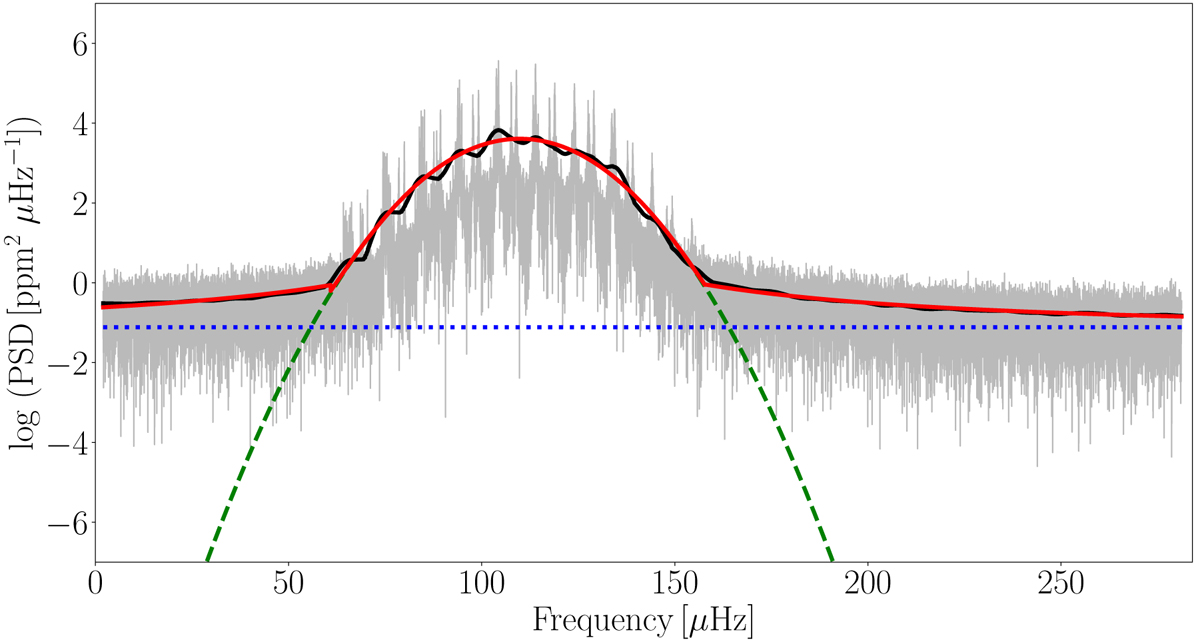
Example of a single-RG PSD fit where light curve contains only the pulsational signal of the RG. The grey line is the unsmoothed PSD, the black line is the smoothed PSD, the red line represents the overall fit, the dashed green line represents the Gaussian used to fit the pulsational power excess, and the blue dotted line represents the white noise.
Current usage metrics show cumulative count of Article Views (full-text article views including HTML views, PDF and ePub downloads, according to the available data) and Abstracts Views on Vision4Press platform.
Data correspond to usage on the plateform after 2015. The current usage metrics is available 48-96 hours after online publication and is updated daily on week days.
Initial download of the metrics may take a while.