Fig. 6
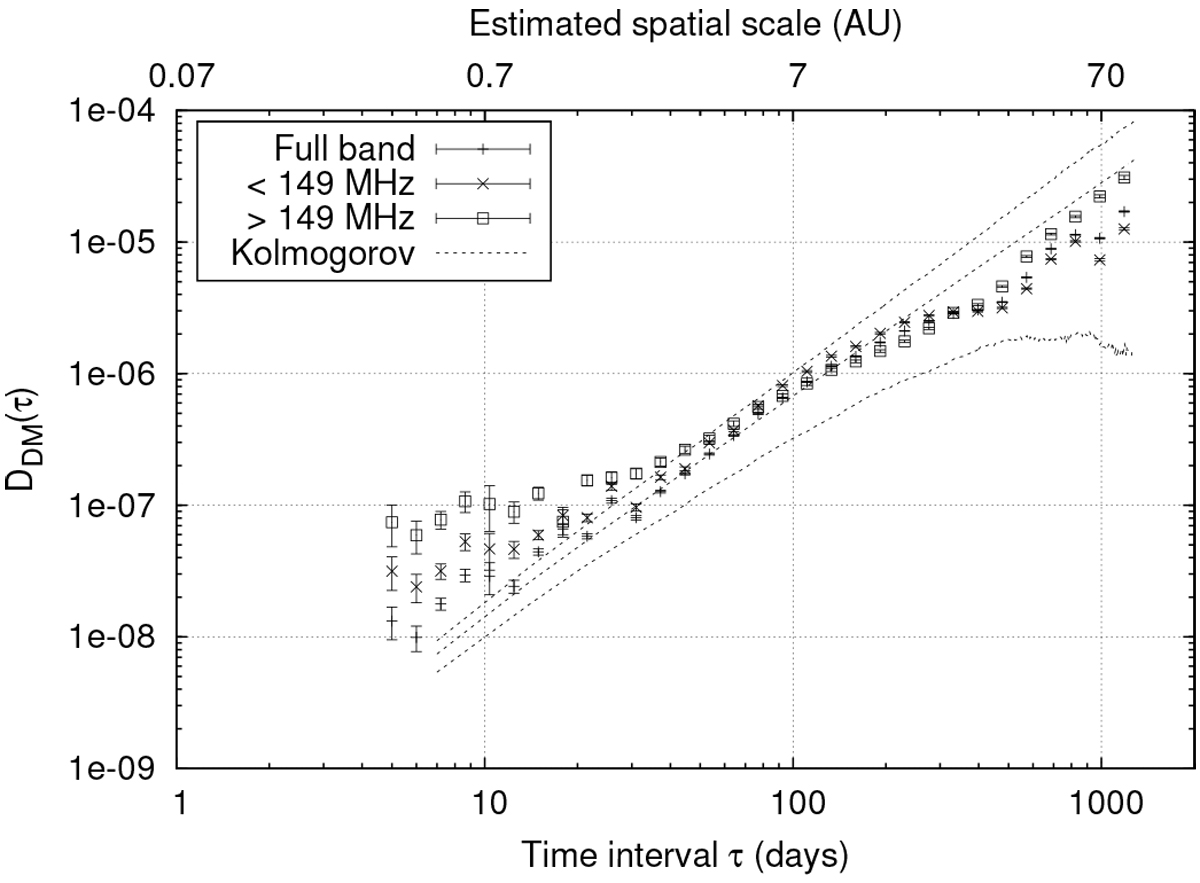
Structure functions of the DM time series from Figs. 1 and 5. The spatial scale is estimated for turbulence half-way to the pulsar, using the proper motion published by Michilli et al. (2018). The Kolmogorov turbulence model is characterised by the structure functions of simulated DM time series derived from a power spectrum with spectral index 5/3. The dotted lines represent the sample average and 1σ-contours of 1000 iterations. The amplitude of the Kolmogorov model was scaled to fit the first 200 days of the data, because the structure function becomes very uncertain at the longest lags.
Current usage metrics show cumulative count of Article Views (full-text article views including HTML views, PDF and ePub downloads, according to the available data) and Abstracts Views on Vision4Press platform.
Data correspond to usage on the plateform after 2015. The current usage metrics is available 48-96 hours after online publication and is updated daily on week days.
Initial download of the metrics may take a while.