Fig. 8
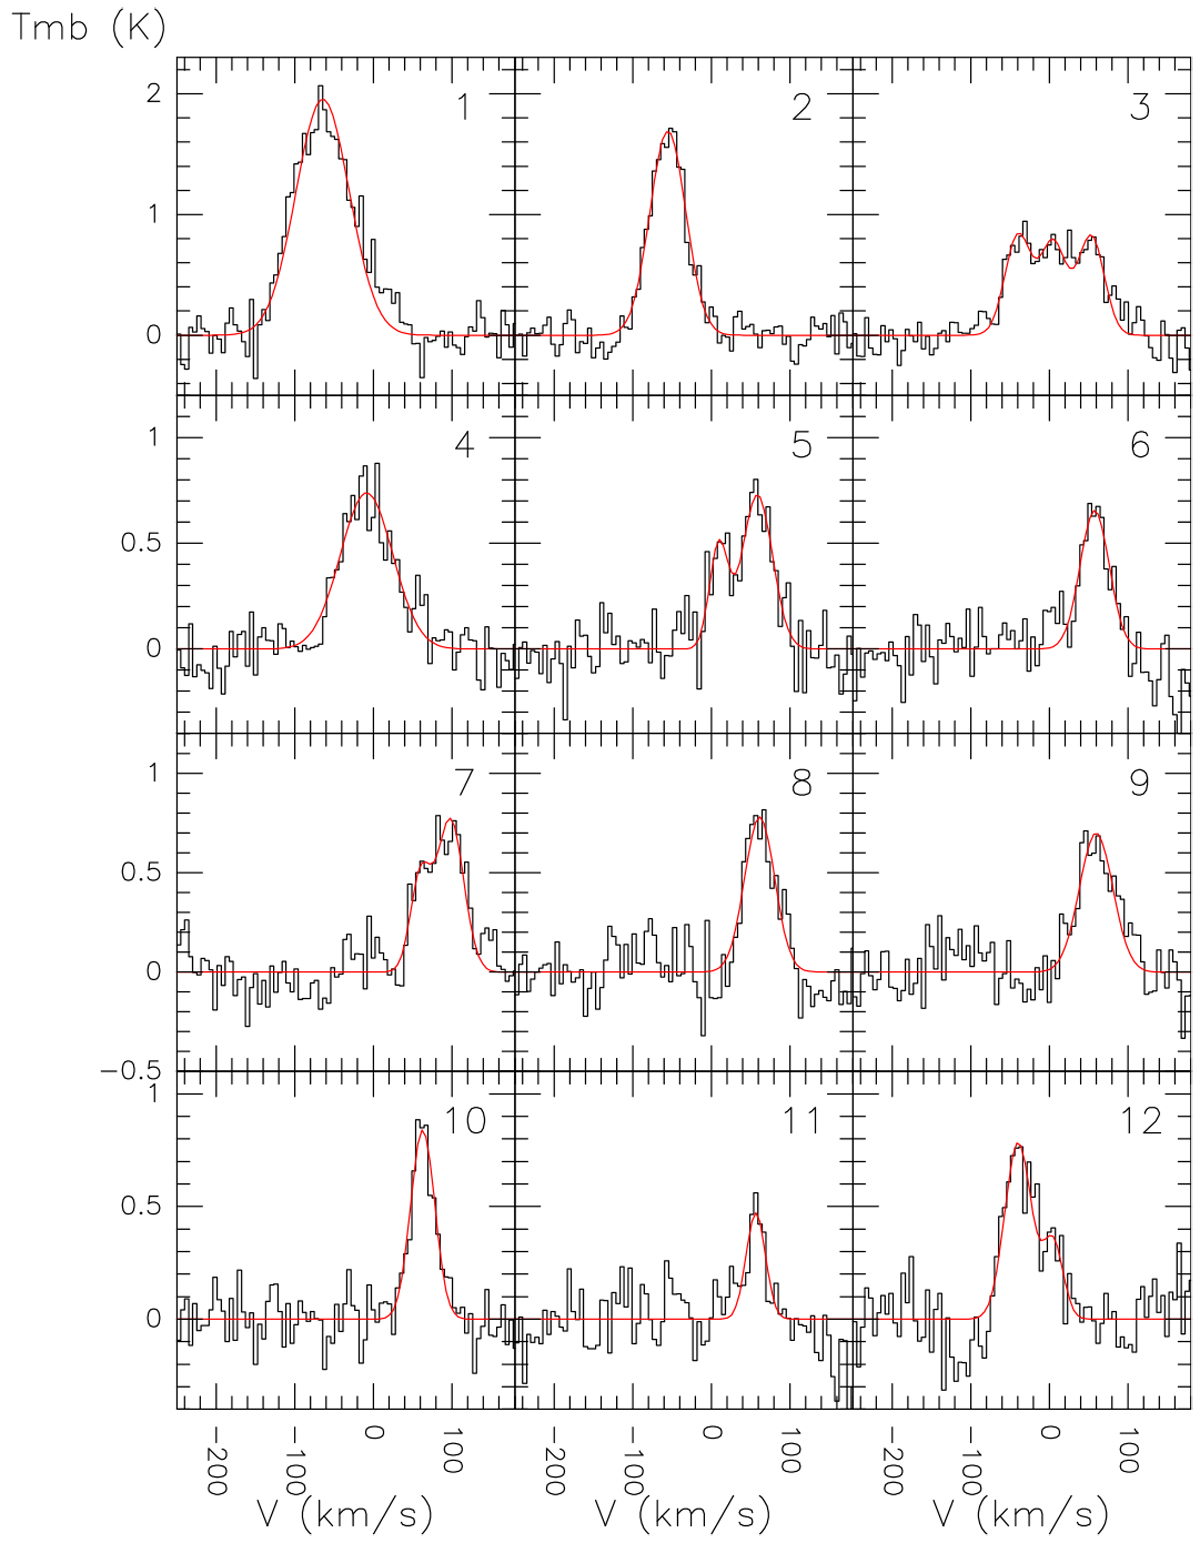
Water 202-111 line profiles (black histogram) observed towards 12 positions (indicated in Fig. 6) on the CND. Gaussian fits to the water lines are shown with a red line. To fit the water line profiles, we have used a single Gaussian except in positions 3, 5, 7, and 12 (three Gaussians in position 3 and two Gaussians in positions 5, 7, and 12).
Current usage metrics show cumulative count of Article Views (full-text article views including HTML views, PDF and ePub downloads, according to the available data) and Abstracts Views on Vision4Press platform.
Data correspond to usage on the plateform after 2015. The current usage metrics is available 48-96 hours after online publication and is updated daily on week days.
Initial download of the metrics may take a while.