Fig. 7
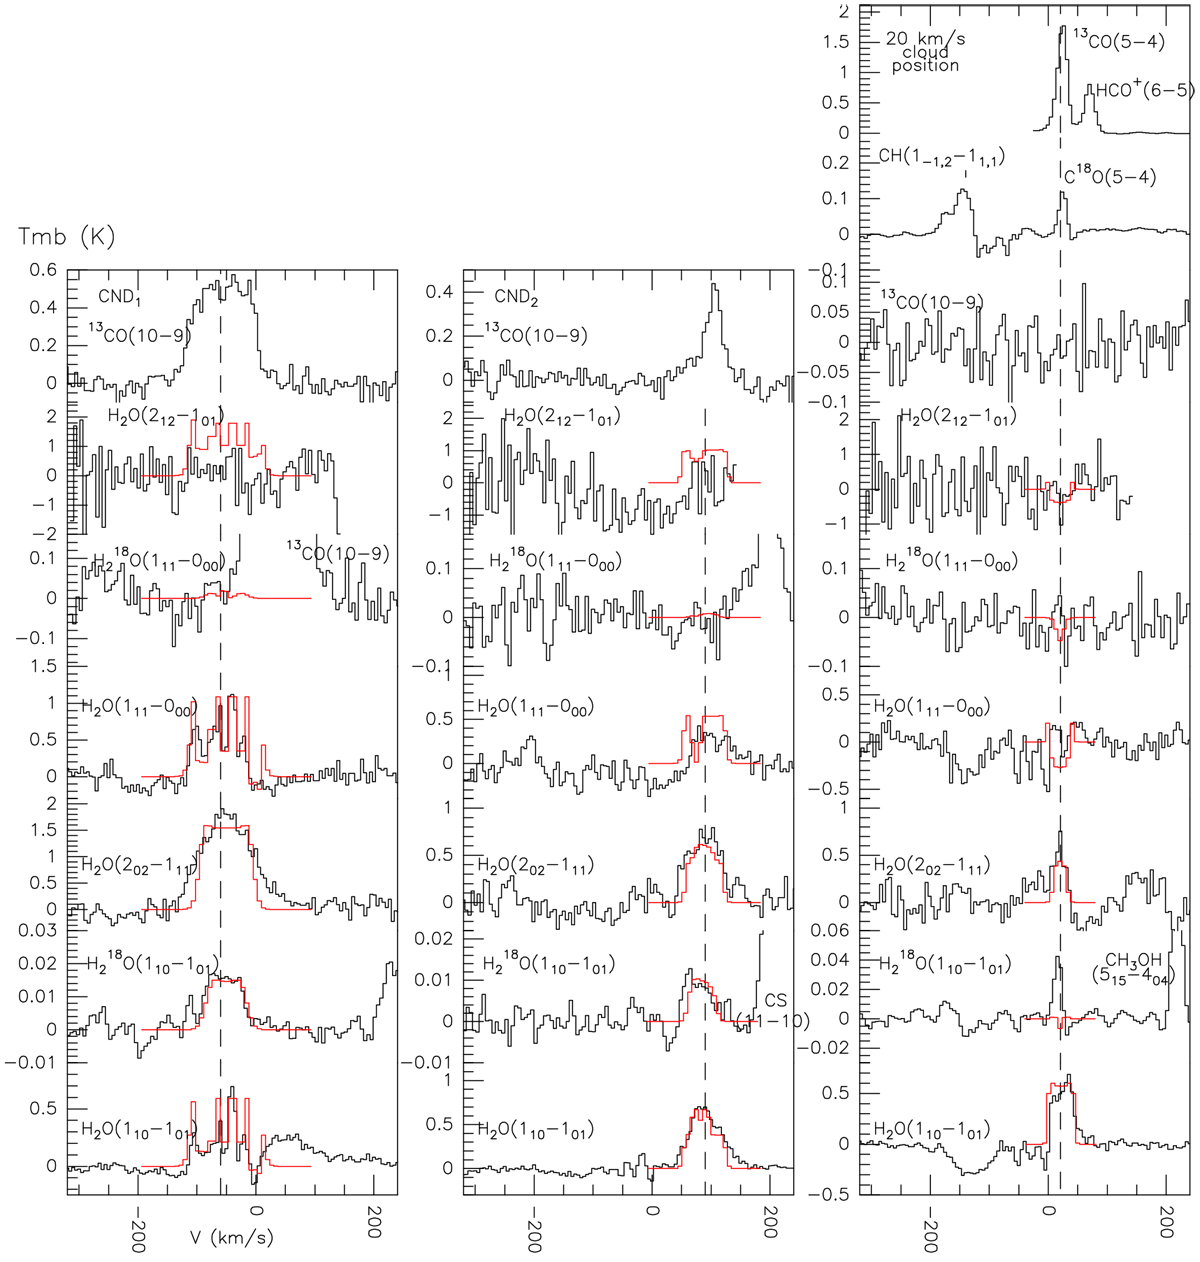
Observational and simulated H2O and H![]() O line profiles. Left panel: observational spectra (black histograms) of four and two transitions of H2O and H
O line profiles. Left panel: observational spectra (black histograms) of four and two transitions of H2O and H![]() O, respectively, for the CND1 position. The modeled water line profiles obtained using a two-component model are shown with red histograms. We also show the 13CO(10-9) line profile. Central panel: observational spectra (black histograms) of four and two transitions of H2O and H
O, respectively, for the CND1 position. The modeled water line profiles obtained using a two-component model are shown with red histograms. We also show the 13CO(10-9) line profile. Central panel: observational spectra (black histograms) of four and two transitions of H2O and H![]() O, respectively, for the CND2 position. The modeled water line profiles obtained using a two-component model are shown with red histograms. Line profiles of 13CO(10–9) and CS(11–10) are also shown, but the CS(11–10) line (near the H
O, respectively, for the CND2 position. The modeled water line profiles obtained using a two-component model are shown with red histograms. Line profiles of 13CO(10–9) and CS(11–10) are also shown, but the CS(11–10) line (near the H![]() O(110–101) line) appears as a consequence of the HIFI double sideband. Right panel: observational spectra (black histograms) of four and two transitions of H2O and H
O(110–101) line) appears as a consequence of the HIFI double sideband. Right panel: observational spectra (black histograms) of four and two transitions of H2O and H![]() O, respectively, for the 20 km s−1 cloud position. The modeled water line profiles are shown with red histograms. Spectral features of 13 CO(10–9), C18 O(5–4), 13 CO(5–4), CH3OH(515 − 404), CH(1−1,2 − 11,1), and HCO+(6–5) are also shown, with the last three lines coming from the HIFI double sideband. The H
O, respectively, for the 20 km s−1 cloud position. The modeled water line profiles are shown with red histograms. Spectral features of 13 CO(10–9), C18 O(5–4), 13 CO(5–4), CH3OH(515 − 404), CH(1−1,2 − 11,1), and HCO+(6–5) are also shown, with the last three lines coming from the HIFI double sideband. The H![]() O(110–101) line is blended with the 13CH3OH(162–161) line (this line also is due to the HIFI double sideband).
O(110–101) line is blended with the 13CH3OH(162–161) line (this line also is due to the HIFI double sideband).
Current usage metrics show cumulative count of Article Views (full-text article views including HTML views, PDF and ePub downloads, according to the available data) and Abstracts Views on Vision4Press platform.
Data correspond to usage on the plateform after 2015. The current usage metrics is available 48-96 hours after online publication and is updated daily on week days.
Initial download of the metrics may take a while.