Fig. 6
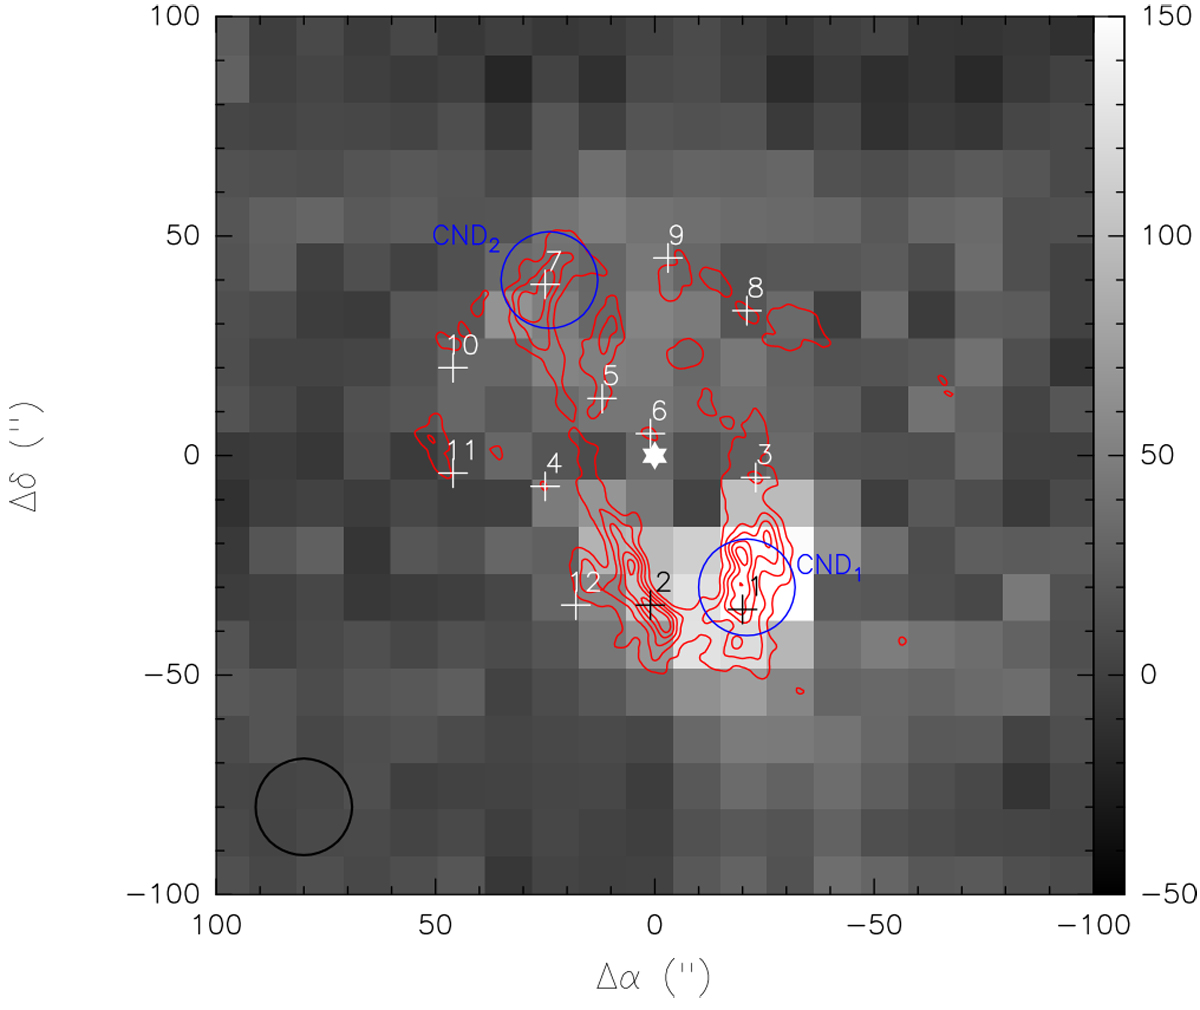
Comparison between the integrated intensity maps of 988 GHz H2O in gray and CN(2–1) (contours, Martín et al. 2012). The integrated velocity range of the H2O map is [−180,140] km s−1. The wedge at the right shows the H2O intensity gray scale in K km s−1. Crosses and their numbers show positions, where spectra used in the kinematic study were extracted over the 22′′ beam. Thesepositions correspond to selected CN(2–1) and H2CO(330–220) emission peaks on the CND (Martín et al. 2012). The white star shows the position of Sgr A* and origin of the offsets. The HIFI beam of 22′′ at 988 GHz is shown in the left corner. Contour levels of the CN map start at 3σ and increase in 4σ steps. Blue circles with a size of 22′′ show the CND1 and CND2 positions selected for our study of the water excitation (see Sect. 5). The CND1 and CND2 positions were observed towards the southwest and northeast lobes, respectively, of the CND (Requena-Torres et al. 2012).
Current usage metrics show cumulative count of Article Views (full-text article views including HTML views, PDF and ePub downloads, according to the available data) and Abstracts Views on Vision4Press platform.
Data correspond to usage on the plateform after 2015. The current usage metrics is available 48-96 hours after online publication and is updated daily on week days.
Initial download of the metrics may take a while.