Fig. 5
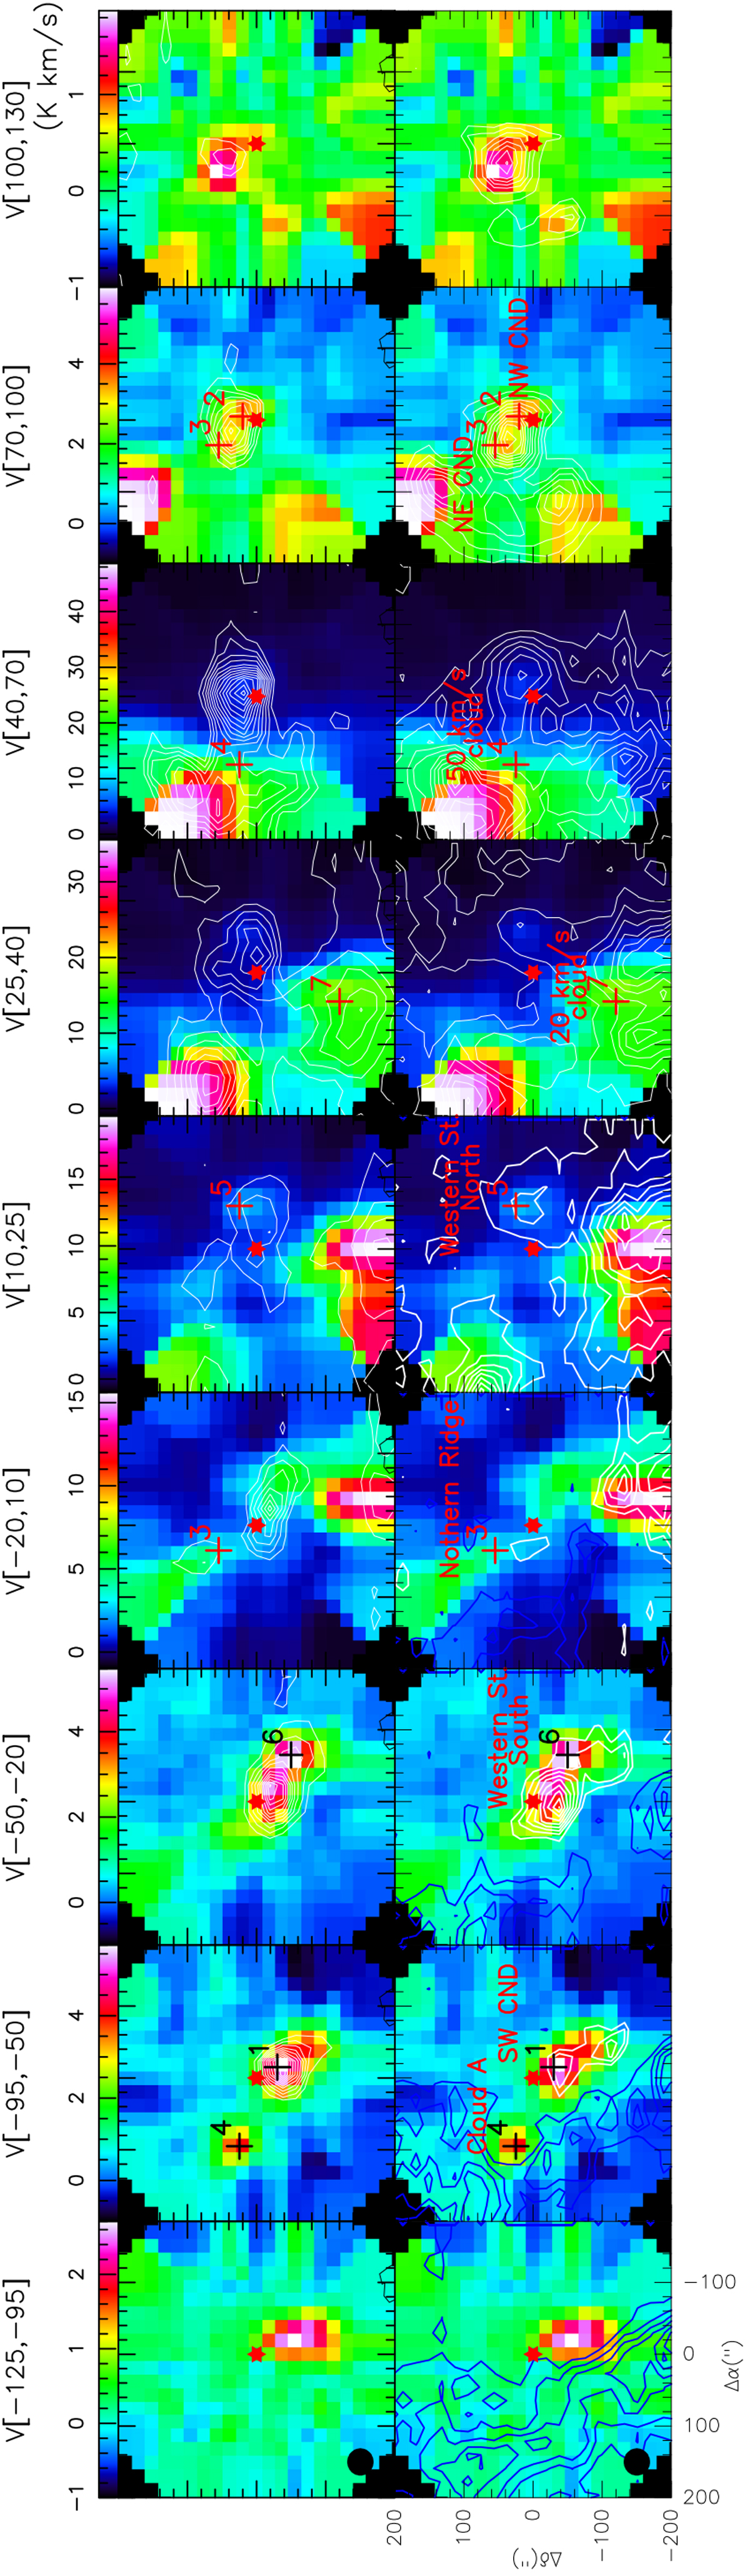
Comparison between the SiO(2–1) maps (background images) obtained by Amo-Baladrón et al. (2011) and our H2O maps at 988 GHz (first row) and 557 GHz (second row). The velocity ranges are indicated at the top of each column. The wedges at the top of the first row show the SiO(2–1) intensity gray scale in K km s−1. H2O contour levels (in blue and white for the absorption and emission, respectively) start at 3σ (−3σ) for the emission (absorption) at the two H2O frequencies, and they increase in 5σ (−5σ) and 4σ steps at 557 and 988 GHz, respectively. The red star represents Sgr A* and origin of the offsets in arcsec. Crosses and their numbers show positions associated with GC sources labeled in the second row. H2O spectra fromthose positions are shown in Fig. 3. The water and SiO(2–1) maps have the same beam size of 38′′ shown in the left corner of the first column.
Current usage metrics show cumulative count of Article Views (full-text article views including HTML views, PDF and ePub downloads, according to the available data) and Abstracts Views on Vision4Press platform.
Data correspond to usage on the plateform after 2015. The current usage metrics is available 48-96 hours after online publication and is updated daily on week days.
Initial download of the metrics may take a while.