Fig. 4
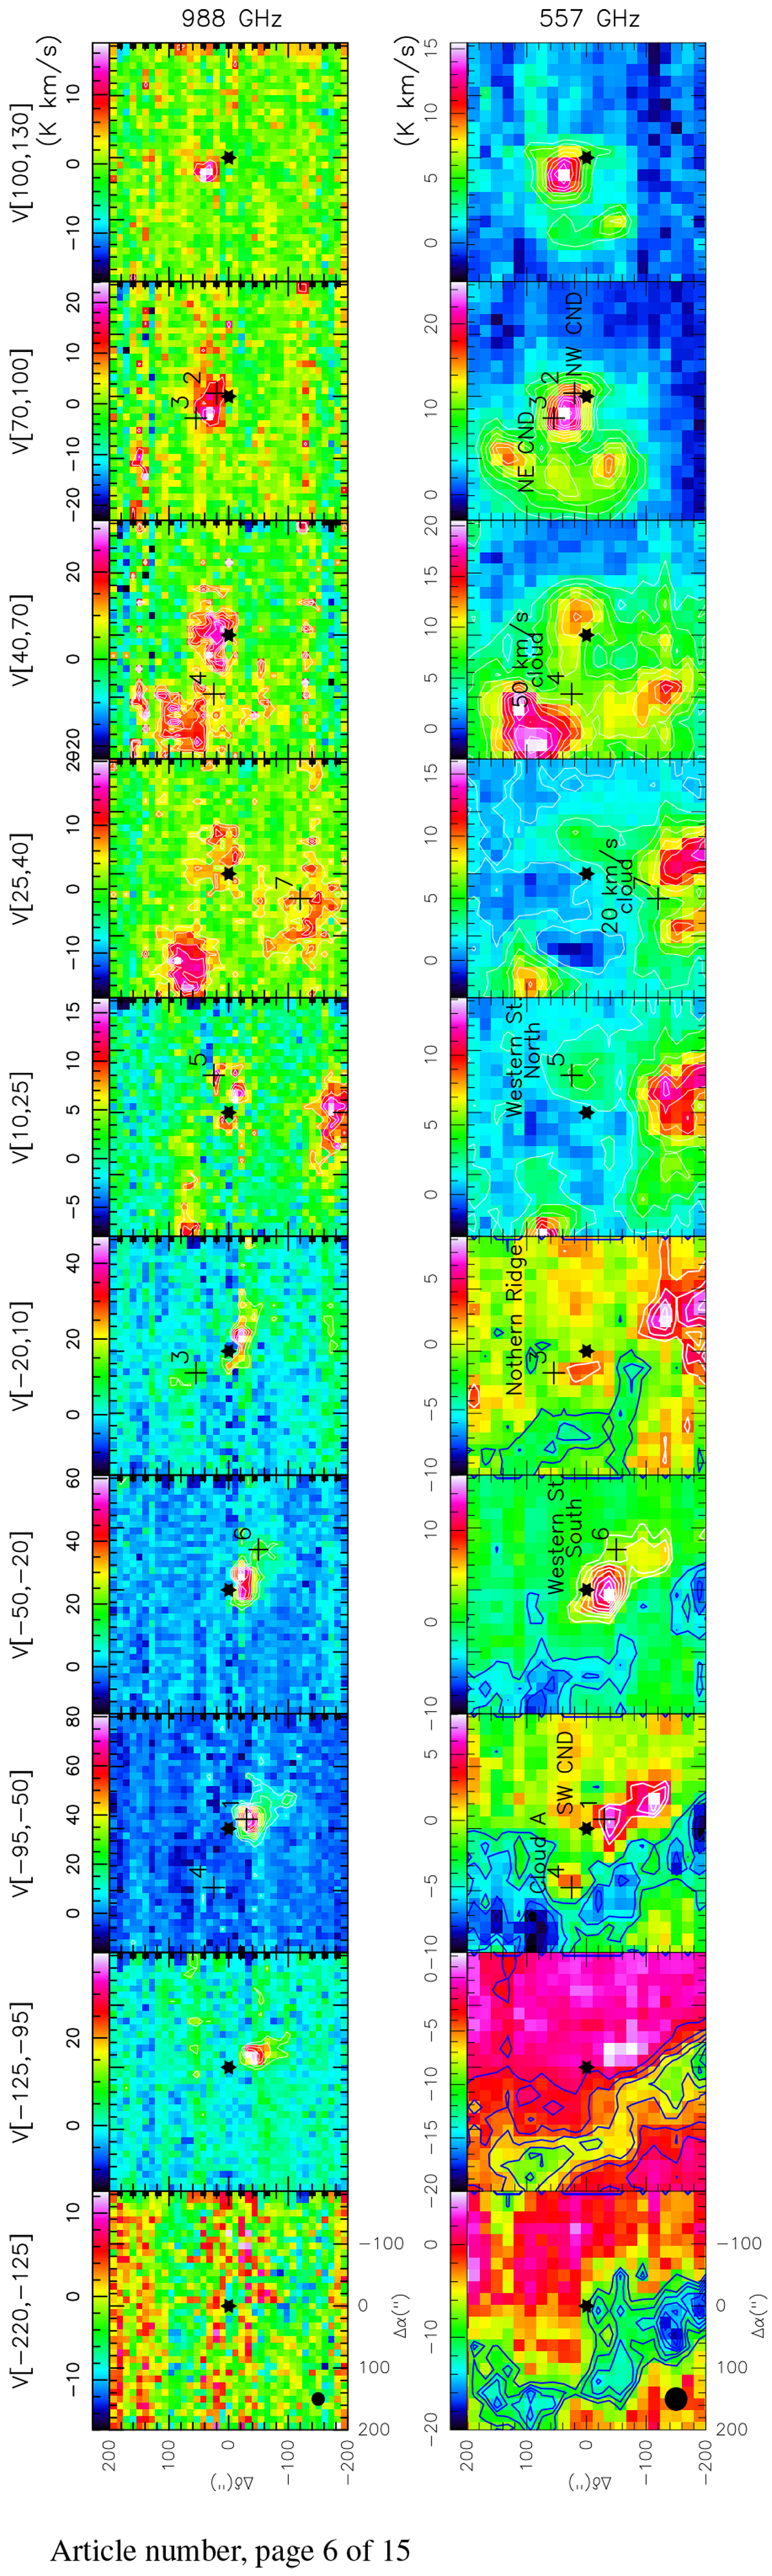
Integrated intensity maps of H2O at 988 GHz (first row) and 557 GHz (second row). The velocity ranges are indicated at the top of each column. The first contour levels of H2O (557 GHz) are at −3σ (blue contour) for the absorption, 3σ (white contour) for the emission in steps of 1.5 K km s−1 (−1.5 K km s−1 for the absorption, σ in the range 1.0–1.5 K km s−1 for all velocity ranges). The first contour levels of H2O (988 GHz) are at 3σ (white contour) for the emission in steps of 7 K km s−1 (σ in the range 2.0–3.5 K km s−1 for all velocity ranges). The wedge above each panel shows the H2O integrated intensity scale given in K km s−1. The black star represents Sgr A* and the origin of the offsets in arcsec. Black crosses and their numbers show positions associated with GC sources labeled in the H2O maps at 557 GHz. Spectra from those positions are shown in Fig. 3. Beam sizes (38′′ at 557 GHz and 22′′ at 988 GHz) are shown in the left corner of the first column.
Current usage metrics show cumulative count of Article Views (full-text article views including HTML views, PDF and ePub downloads, according to the available data) and Abstracts Views on Vision4Press platform.
Data correspond to usage on the plateform after 2015. The current usage metrics is available 48-96 hours after online publication and is updated daily on week days.
Initial download of the metrics may take a while.