Fig. 3
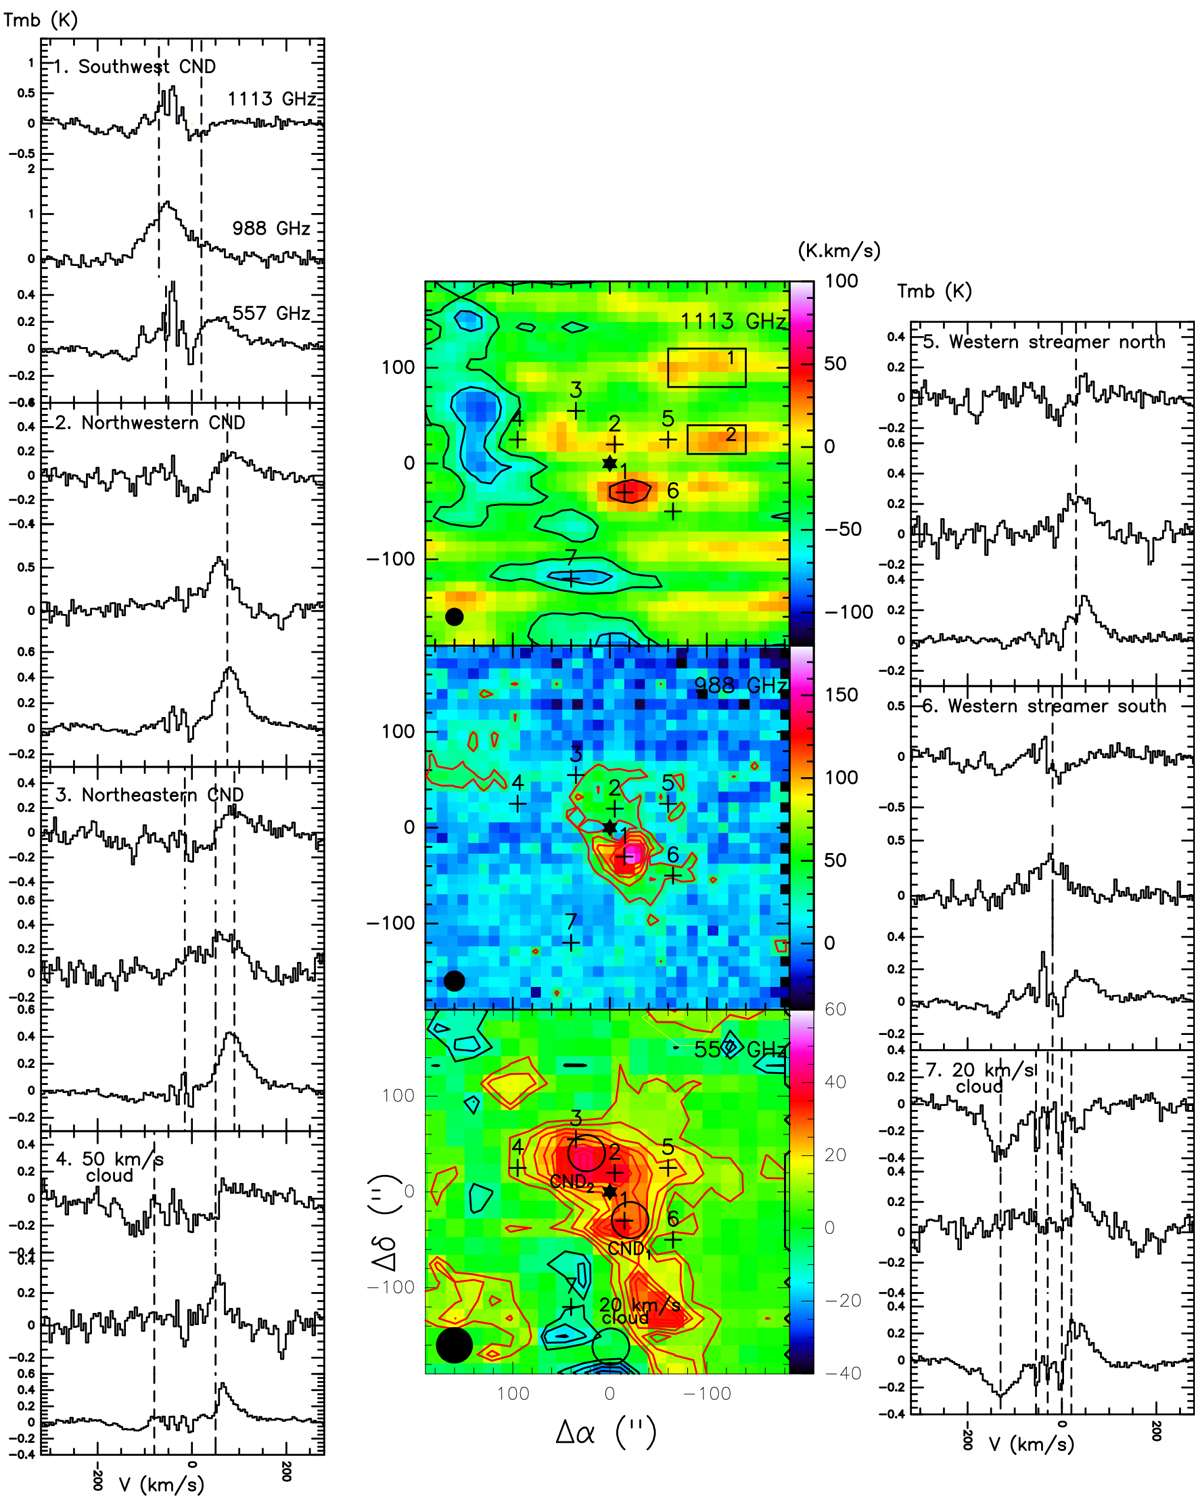
Central panels: velocity integrated intensity maps of H2O at 557,988, and 1113 GHz. The beam sizes are shown in the left corner of each map. The maps at the three frequencies were integrated over the velocity range of [−180,+140] km s−1. The first contour levels for the H2O maps at 557 and 1113 GHz are at −3σ (black contour) for the absorption, 3σ (red contour) for the emission, but the 988 GHz line is at 3σ (red contour) for the emission. The steps are of 4.5 K km s−1 (−4.5 K km s−1 for the absorption) at 557 GHz and 26.0 K km s−1 (−26.0 K km s−1 for the absorption at 1113 GHz) at 988 and 1113 GHz (σ = 4.1, 11.3, and 9.6K km s−1 at 557, 987, and 1113 GHz, respectively). Sgr A* is shown with a black star and it is the origin of the offsets. Black crosses and their numbers show the positions where spectra of the left and right panels were extracted. Every position is associated with a representative GC feature (see below). The three positions where the H![]() O spectra were obtained are also shown with black circles on the 557 GHz water map and labeled as CND1 , CND2 , and 20 km s−1 cloud (see Fig. 7). The H2O and H
O spectra were obtained are also shown with black circles on the 557 GHz water map and labeled as CND1 , CND2 , and 20 km s−1 cloud (see Fig. 7). The H2O and H![]() O emission toward these positions is modeled in Sect. 5. The wedges to the right show the H2O integrated intensity scale. The parallelograms 1 and 2 shown in the 1113 GHz H2O map were used to extract the average spectra indicated in Fig. A.1, illustrating the baseline levels. Left and right panels: spectra from seven positions of the 557, 988, and the 1113 GHz lines. Each spectrum was extracted from H2O cubes convolved with the HIFI 38′′ beam of the 557 GHz line. The numbers in the upper left side of each subpanel show positions (indicated in the H2O maps) associated with GC features. These features and their systemic velocities (indicated with dashed lines in the H2O spectra) are: (1) the southwestern CND (−70 km s−1 , this position also covers the northern part of the 20 km s−1 cloud), (2), the northwestern CND (75 km s−1), (3) the northeastern CND (90 km s−1, this position also covers the Northern Ridge with a velocity of −15 km s−1 and the 50 km s−1 cloud), (4) the 50 km s−1 cloud (this position also covers Cloud A with a velocity of −80 km s−1), (5) the Western Streamer north (30 km s−1), (6) the Western Streamer south (−20 km s−1), and (7) the 20 km s−1 cloud. In the subpanel of position 7 we have also indicated with dashed lines the velocities of the absorption features associated with foreground sources (see Sect. 3).
O emission toward these positions is modeled in Sect. 5. The wedges to the right show the H2O integrated intensity scale. The parallelograms 1 and 2 shown in the 1113 GHz H2O map were used to extract the average spectra indicated in Fig. A.1, illustrating the baseline levels. Left and right panels: spectra from seven positions of the 557, 988, and the 1113 GHz lines. Each spectrum was extracted from H2O cubes convolved with the HIFI 38′′ beam of the 557 GHz line. The numbers in the upper left side of each subpanel show positions (indicated in the H2O maps) associated with GC features. These features and their systemic velocities (indicated with dashed lines in the H2O spectra) are: (1) the southwestern CND (−70 km s−1 , this position also covers the northern part of the 20 km s−1 cloud), (2), the northwestern CND (75 km s−1), (3) the northeastern CND (90 km s−1, this position also covers the Northern Ridge with a velocity of −15 km s−1 and the 50 km s−1 cloud), (4) the 50 km s−1 cloud (this position also covers Cloud A with a velocity of −80 km s−1), (5) the Western Streamer north (30 km s−1), (6) the Western Streamer south (−20 km s−1), and (7) the 20 km s−1 cloud. In the subpanel of position 7 we have also indicated with dashed lines the velocities of the absorption features associated with foreground sources (see Sect. 3).
Current usage metrics show cumulative count of Article Views (full-text article views including HTML views, PDF and ePub downloads, according to the available data) and Abstracts Views on Vision4Press platform.
Data correspond to usage on the plateform after 2015. The current usage metrics is available 48-96 hours after online publication and is updated daily on week days.
Initial download of the metrics may take a while.