Fig. A.1
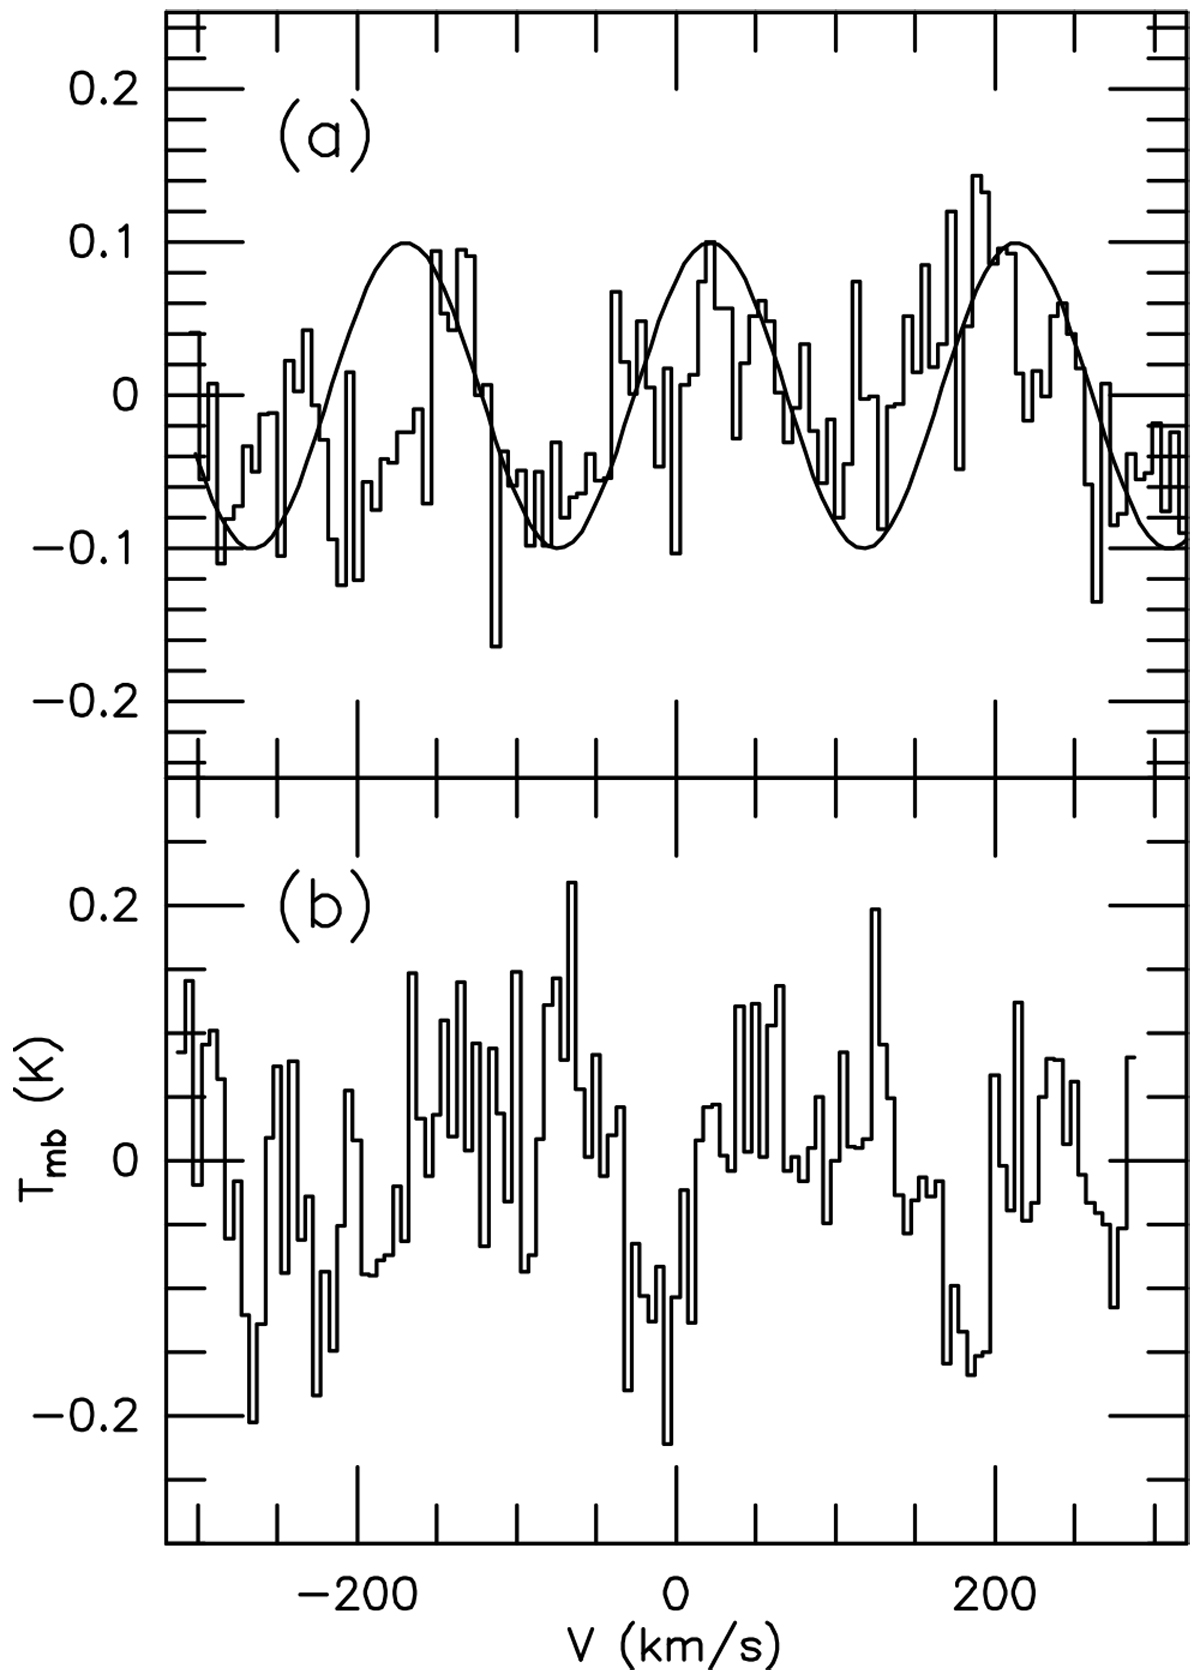
Panels a and b: average spectra extracted from parallelograms 1 and 2, respectively, shown in Fig. 3. The spectra are affected by standing waves, with a period around 200 km s−1, which originate from the local oscillator feed horns of HIFI (see Sect. 3). Panel a illustrates a sine function, highlighting the shape of the standing wave.
Current usage metrics show cumulative count of Article Views (full-text article views including HTML views, PDF and ePub downloads, according to the available data) and Abstracts Views on Vision4Press platform.
Data correspond to usage on the plateform after 2015. The current usage metrics is available 48-96 hours after online publication and is updated daily on week days.
Initial download of the metrics may take a while.