Fig. 1
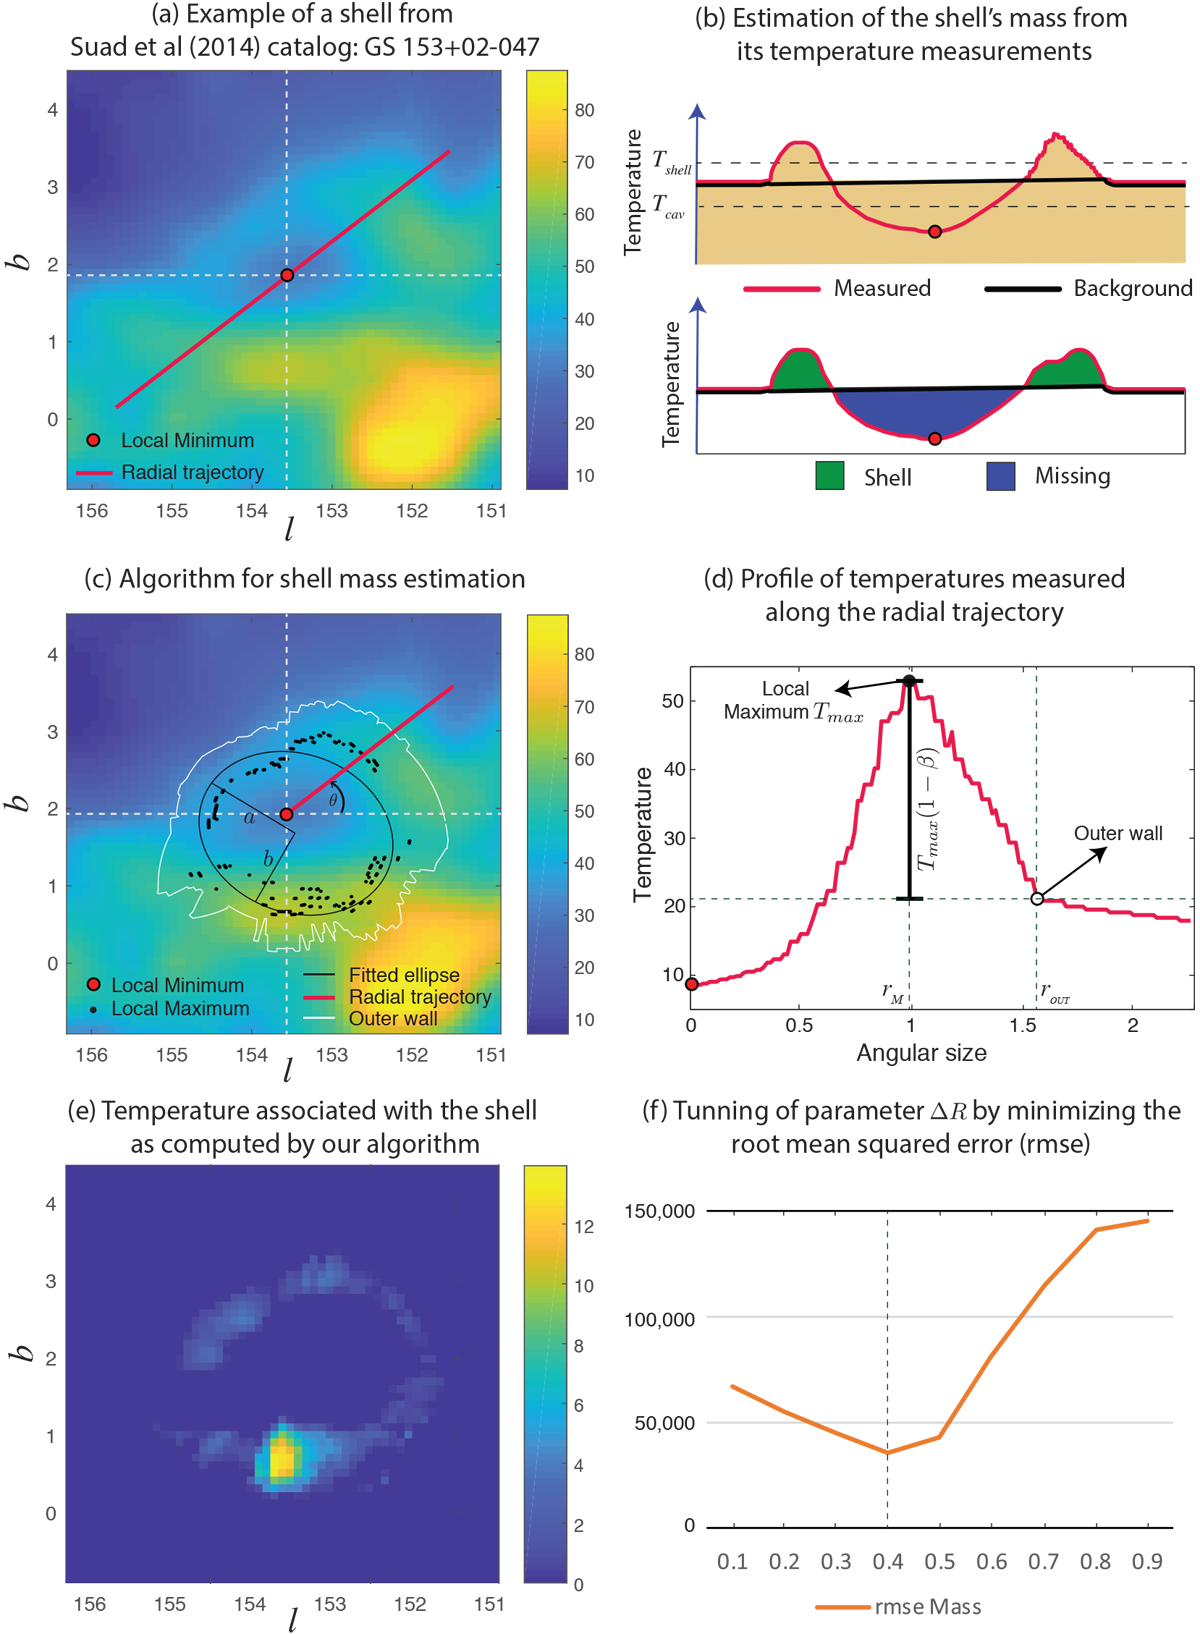
Estimating the mass associated with a Galactic supershell, the example of GS 153+02-047: (a) averaged temperature image computed using the 70% of channels where the GS is detected in order to avoid the caps; (b) Top panel: temperature profile computed along the red line trajectory shown in a. The background temperature profile (black) is defined by connecting with a line the external limits of the shell. The averaged temperatures of the shell and the cavity are Tshell and Tcav, respectively. Bottom panel: temperature of the shell (green) is computed as the excess of temperature with respect to the background temperature level. The temperature associated with the missing mass (blue) is computed as the required temperature to be added in the cavity in order to reach the background level; (c) description of the algorithm for computing masses. Radial trajectories (red lines) are used for computing temperature profiles and detecting local maxima (black dots) and outer walls of the structure. Once local maxima are detected, the algorithm fits an ellipse to those points (black line); (d) details of the temperature profile computed based on the radial trajectory displayed in panel c; (e) image of the temperature of the shell as computed by subtracting the background from the measured temperature as explained in panel b and Eq. (6); (f) the global parameter ΔR is tuned such that the error of the algorithm (rmse) is minimized when it is compared against a subset of structures analysed “by hand”. The optimal value of this parameter is ΔR = 0.4.
Current usage metrics show cumulative count of Article Views (full-text article views including HTML views, PDF and ePub downloads, according to the available data) and Abstracts Views on Vision4Press platform.
Data correspond to usage on the plateform after 2015. The current usage metrics is available 48-96 hours after online publication and is updated daily on week days.
Initial download of the metrics may take a while.