Fig. 5.
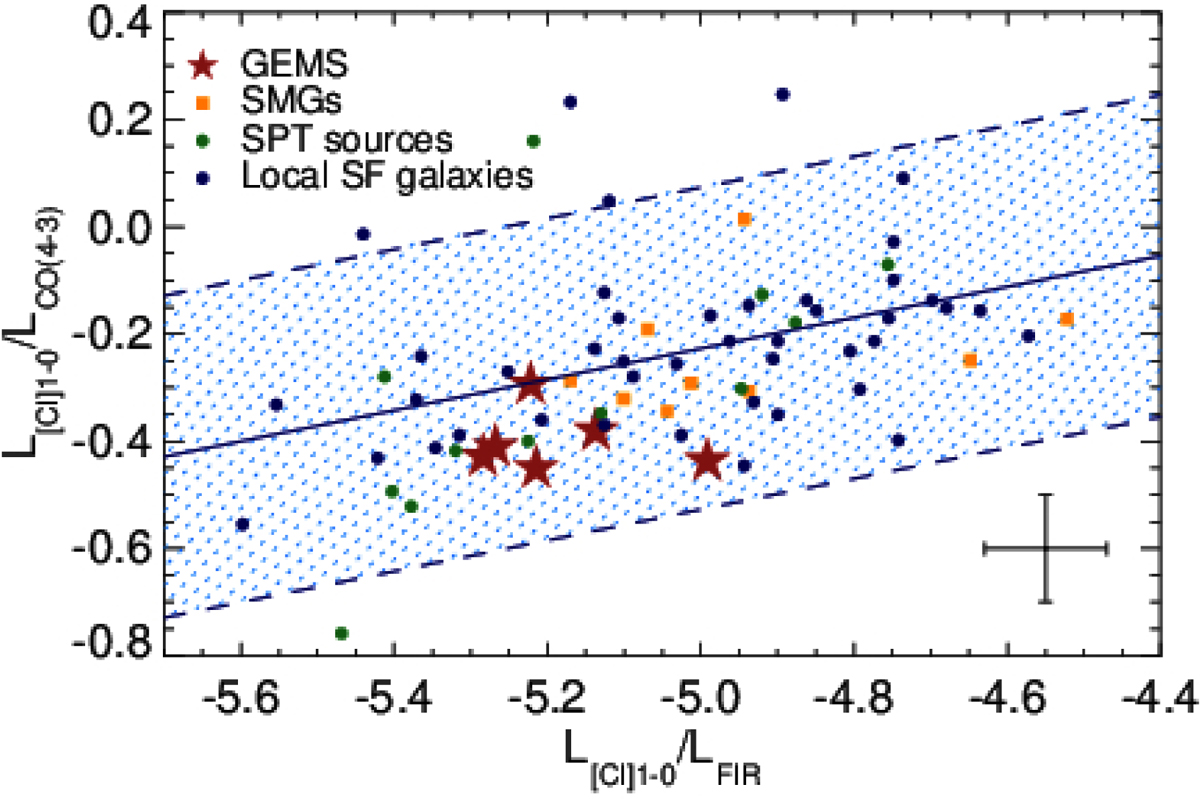
Ratio of LCI1 − 0 to LCO(4 − 3) as a function of the cooling budget through [CI] 1–0. The red stars are the GEMS. Blue, green, and orange dots indicate the samples of low-redshift star-forming galaxies from Kamenetzky et al. (2016), and the high-redshift samples of gravitationally lensed sources from the SPT (Bothwell et al. 2017) and the submillimeter galaxies of Alaghband-Zadeh et al. (2013), respectively. The blue line shows the average relationship derived from the comparison samples. The blue hatched region shows a range of a factor of ±2 around this average. The typical measurement uncertainty is shown in the lower-right corner.
Current usage metrics show cumulative count of Article Views (full-text article views including HTML views, PDF and ePub downloads, according to the available data) and Abstracts Views on Vision4Press platform.
Data correspond to usage on the plateform after 2015. The current usage metrics is available 48-96 hours after online publication and is updated daily on week days.
Initial download of the metrics may take a while.