Fig. 4.
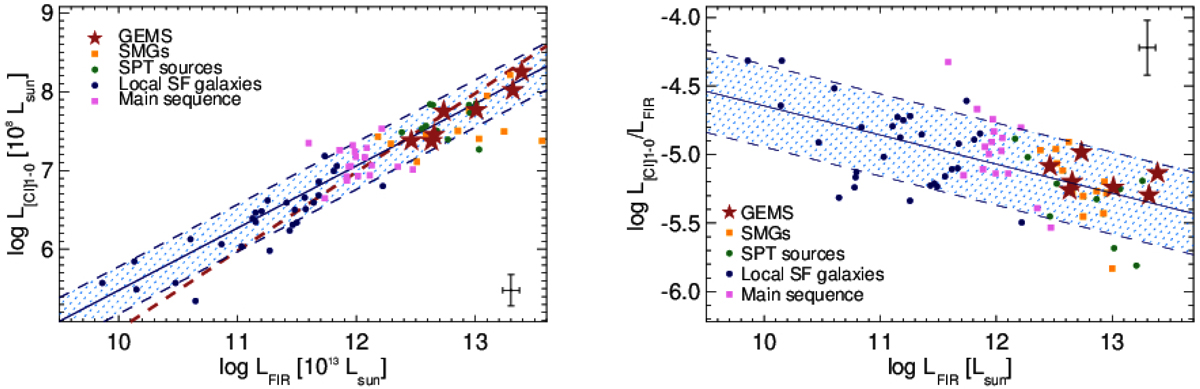
Cooling budget through [CI]1–0 line emission. [CI]1–0 luminosity (left panel), LCI1 − 0, and ratio with FIR luminosity, LCI1 − 0/LFIR (right panel), as a function of FIR luminosity, LFIR. The red stars are the GEMS. Blue, pink, green, and yellow symbols indicate the samples of low-redshift spiral galaxies from Kamenetzky et al. (2016), the main sequence galaxies at z ∼ 1.2 from Valentino et al. (2018), the high-redshift samples of gravitationally lensed sources from the South Pole Telescope (Bothwell et al. 2017) and the submillimeter galaxies of Alaghband-Zadeh et al. (2013), respectively. The blue line shows the average relationships derived by Valentino et al. (2018) for their main sequence galaxies and comparison samples, and the red line shows an equivalent relationship with a slope of unity. Blue hatched bands show a range of ±2 around these averages. Typical error bars of our measurements are shown in the lower- and upper-right corners of the two panels, respectively.
Current usage metrics show cumulative count of Article Views (full-text article views including HTML views, PDF and ePub downloads, according to the available data) and Abstracts Views on Vision4Press platform.
Data correspond to usage on the plateform after 2015. The current usage metrics is available 48-96 hours after online publication and is updated daily on week days.
Initial download of the metrics may take a while.