Open Access
Fig. 1.
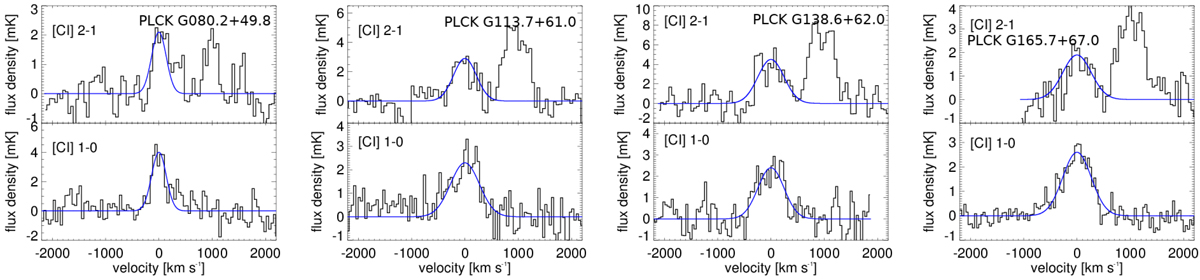
[CI] 2–1 and CO(7–6) (top panel) and [CI] 1–0 (bottom panel) spectra of the four GEMS for which we observed both lines. The blue curve shows the single-component Gaussian fit to the [CI] lines. Upper panel: CO(7–6), which is redshifted relative to [CI] 2–1, and is discussed in detail in C18.
Current usage metrics show cumulative count of Article Views (full-text article views including HTML views, PDF and ePub downloads, according to the available data) and Abstracts Views on Vision4Press platform.
Data correspond to usage on the plateform after 2015. The current usage metrics is available 48-96 hours after online publication and is updated daily on week days.
Initial download of the metrics may take a while.