Fig. 4.
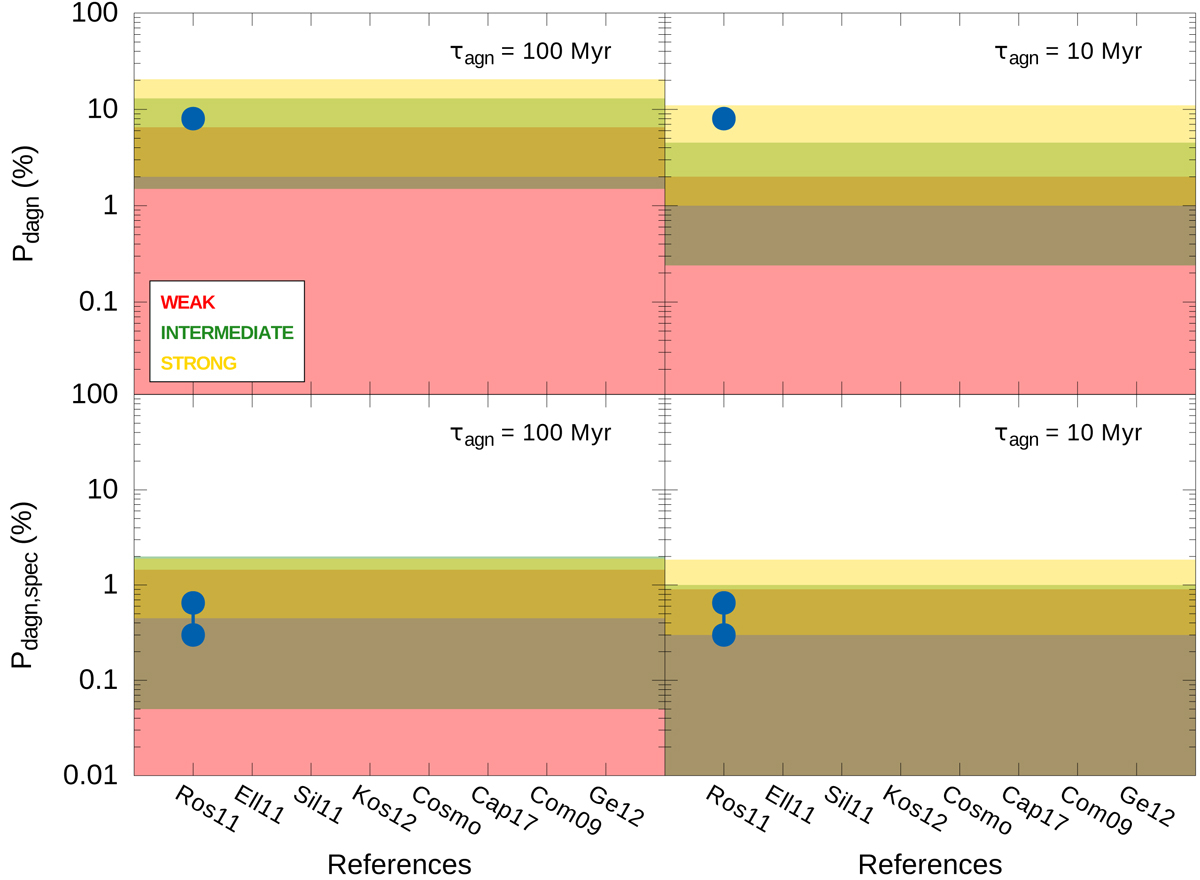
Comparison of our results for Pdagn (top) and Pdagn, spec (bottom) with observations and other theoretical predictions. The total ranges of plausible values for these probabilities inferred from all the major mergers in our suite, i.e. regardless of the orbital eccentricity, orbital energy and mass ratio of the progenitor galaxies, are represented by means of horizontal bands color coded to show the different thresholds of the bolometric X-ray luminosity adopted in our numerical DAGN model (see the inset in the top-left panel). The panels on each column depict results for different durations of the AGN phase, τagn: 100 Myr (left) and 10 Myr (right). Distributed between this figure and Fig. 5, we show a set of benchmarks formed by the individual values and/or ranges of values quoted in the observational works by Rosario et al. (2011, Ros11), Ellison et al. (2011, Ell11), Silverman et al. (2011, Sil11) and Koss et al. (2012, Kos12), which are represented by blue solid circles, those corresponding to our own estimates based on the large AGN surveys by Comerford et al. (2009, Com09) and Ge et al. (2012, Ge12), represented by blue solid squares, as well as those stemming from the cosmological simulations by Rosas-Guevara et al. (2019), Volonteri et al. (2016) and Steinborn et al. (2016) that we group under the same label (Cosmo), and from the isolated merging runs of Capelo et al. (2017, Cap17), which are identified by red solid circles.
Current usage metrics show cumulative count of Article Views (full-text article views including HTML views, PDF and ePub downloads, according to the available data) and Abstracts Views on Vision4Press platform.
Data correspond to usage on the plateform after 2015. The current usage metrics is available 48-96 hours after online publication and is updated daily on week days.
Initial download of the metrics may take a while.