Fig. 8.
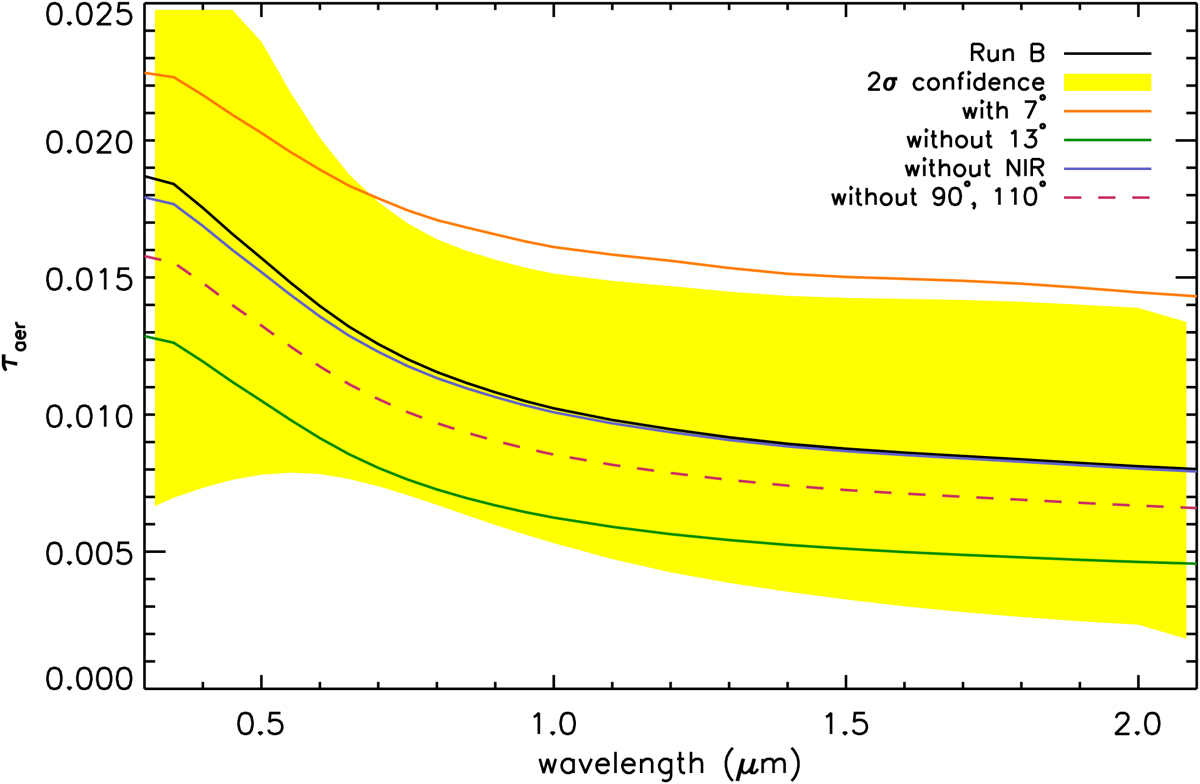
Robustness of the analysis for determining the most likely aerosol extinction curve. The standard analysis (Run B, black), which includes all observations except ρ = 7°, with the yellow region giving the 2σ confidence interval, is plotted. Over-plotted are the same procedures but including ρ = 7° (orange), excluding ρ = 13° (green), excluding the NIR arm (blue), and excluding ρ = 90 and 110°.
Current usage metrics show cumulative count of Article Views (full-text article views including HTML views, PDF and ePub downloads, according to the available data) and Abstracts Views on Vision4Press platform.
Data correspond to usage on the plateform after 2015. The current usage metrics is available 48-96 hours after online publication and is updated daily on week days.
Initial download of the metrics may take a while.