Fig. 6.
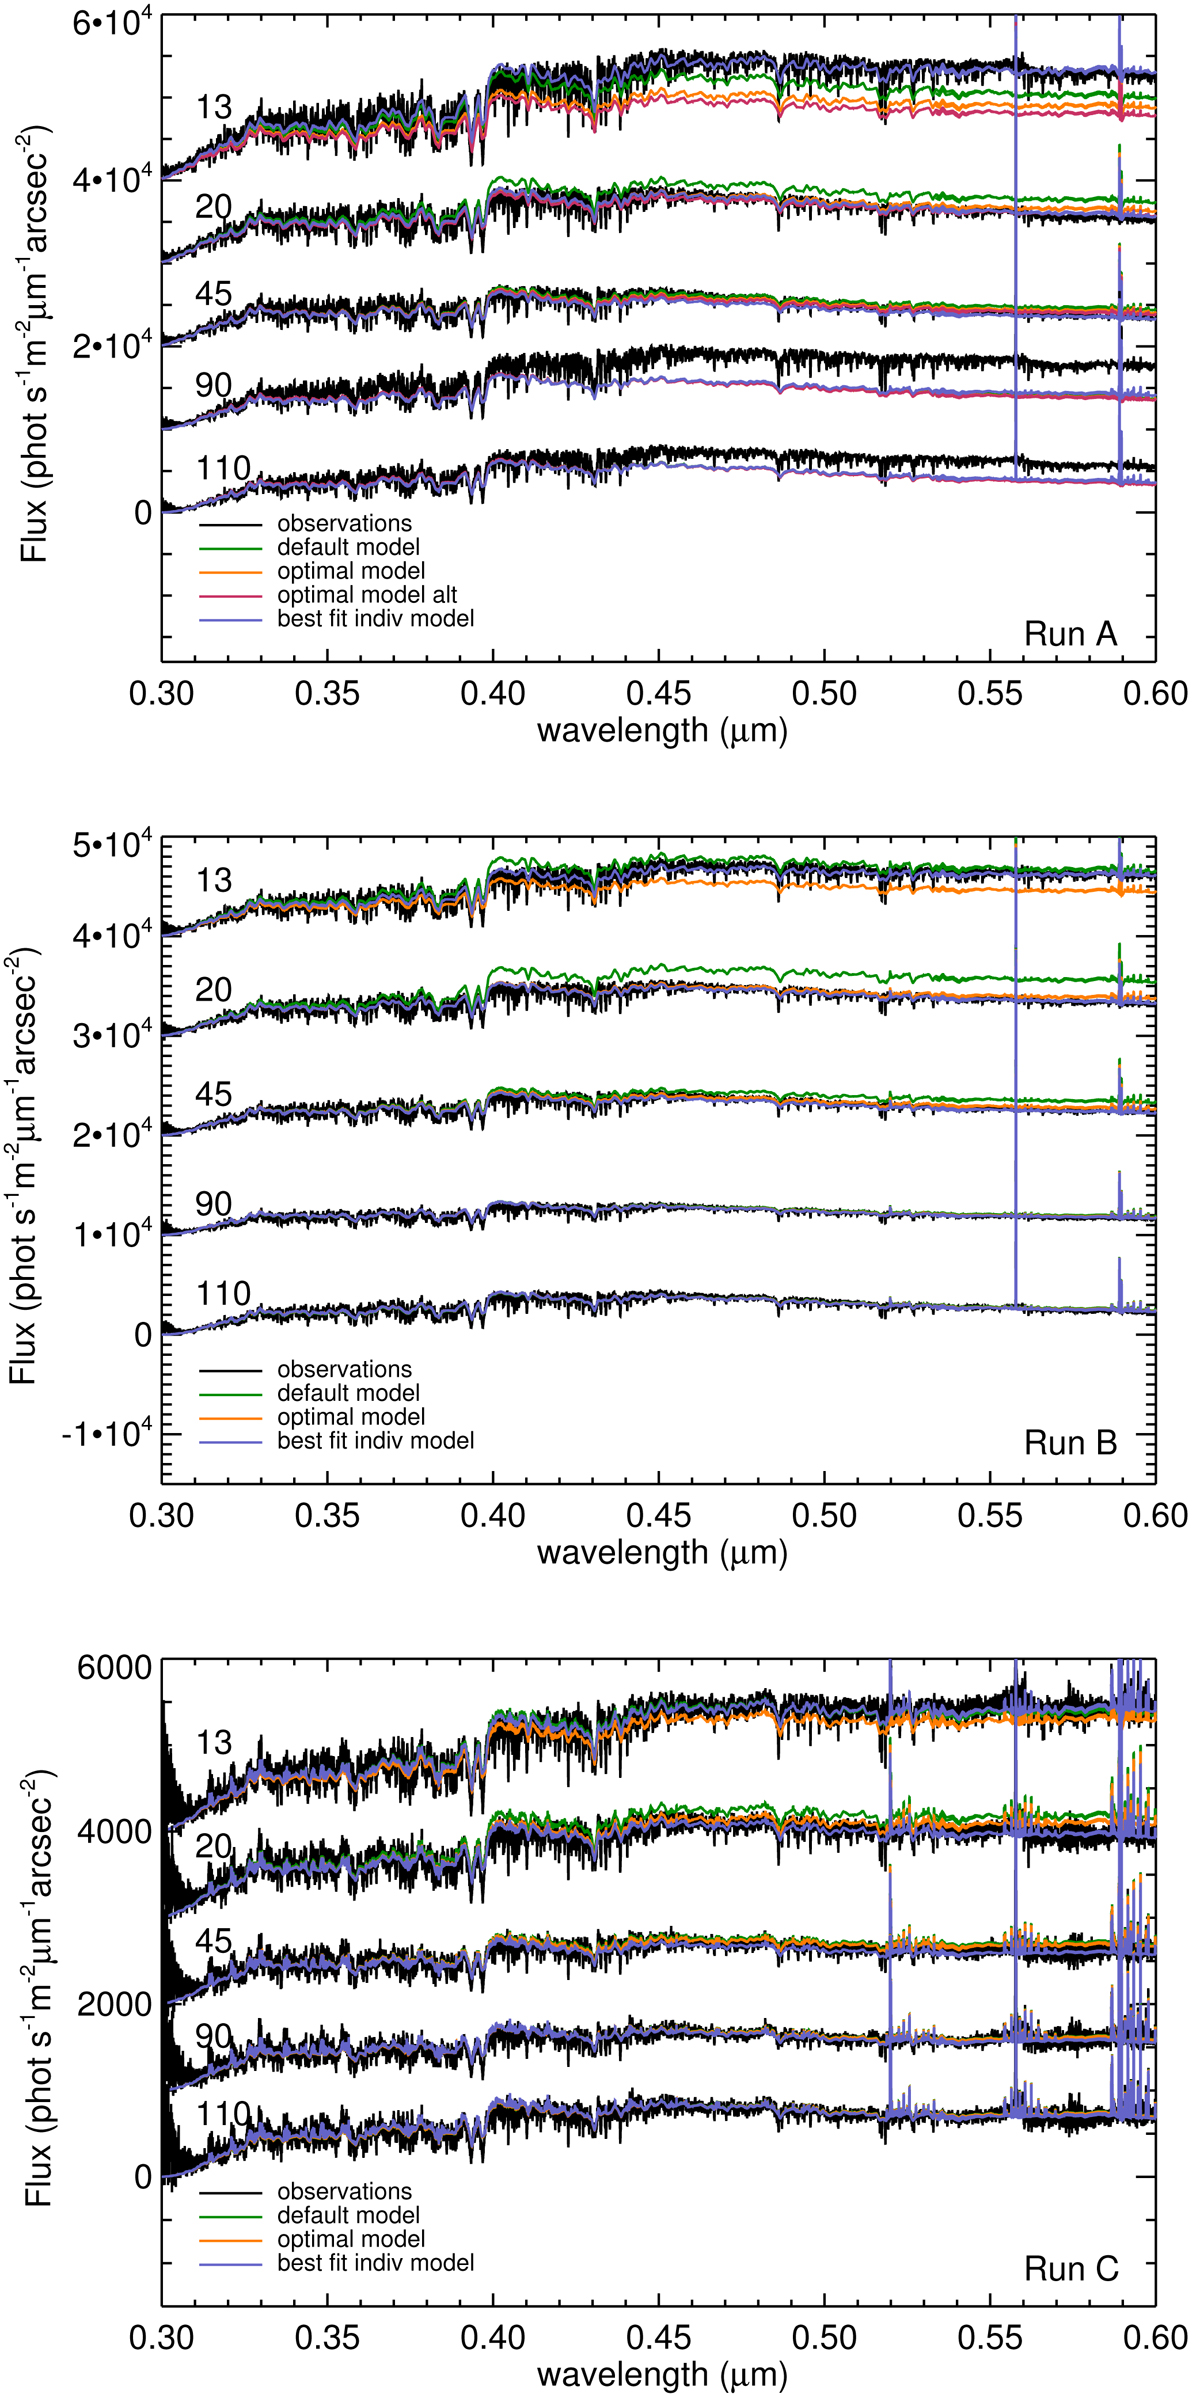
Sky observations (black) with various sky background models over-plotted for Run A (top panel), Run B (middle panel) and Run C (bottom panel). The observations taken at different ρ, 13, 20, 45, 90, and 110°, have been offset in flux for clarity. The different models are the current sky background model with F = 1.0 (green), the model run with the most likely extinction curve (optimal model; orange), and the best fit individual model (blue).
Current usage metrics show cumulative count of Article Views (full-text article views including HTML views, PDF and ePub downloads, according to the available data) and Abstracts Views on Vision4Press platform.
Data correspond to usage on the plateform after 2015. The current usage metrics is available 48-96 hours after online publication and is updated daily on week days.
Initial download of the metrics may take a while.