Free Access
Fig. 11.
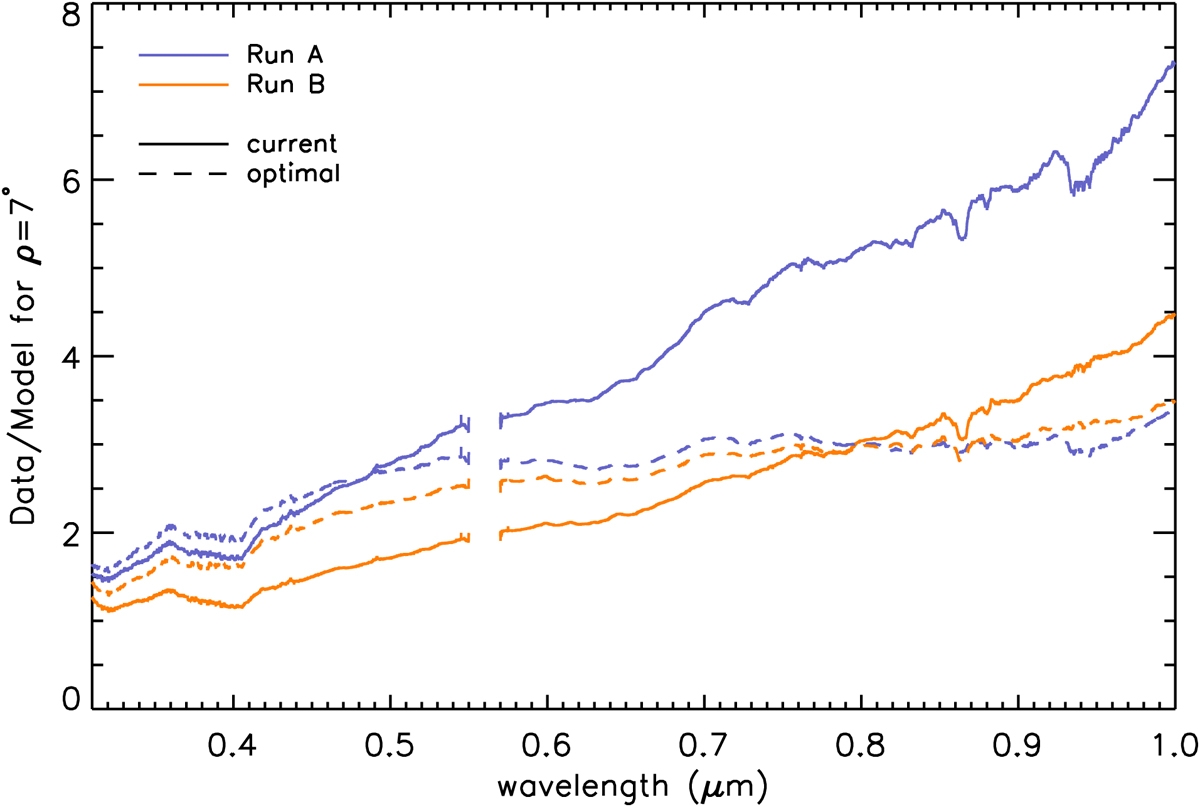
Ratio of the observed data over the current model (solid) and optimal model (dashed), both with F = 1.0, for Run A and B at ρ = 7°. The ratio was smoothed to better show the trend with wavelength. The gap is where the two arms overlap at the edges of the spectrographs and is clipped for clarity.
Current usage metrics show cumulative count of Article Views (full-text article views including HTML views, PDF and ePub downloads, according to the available data) and Abstracts Views on Vision4Press platform.
Data correspond to usage on the plateform after 2015. The current usage metrics is available 48-96 hours after online publication and is updated daily on week days.
Initial download of the metrics may take a while.