Fig. 10.
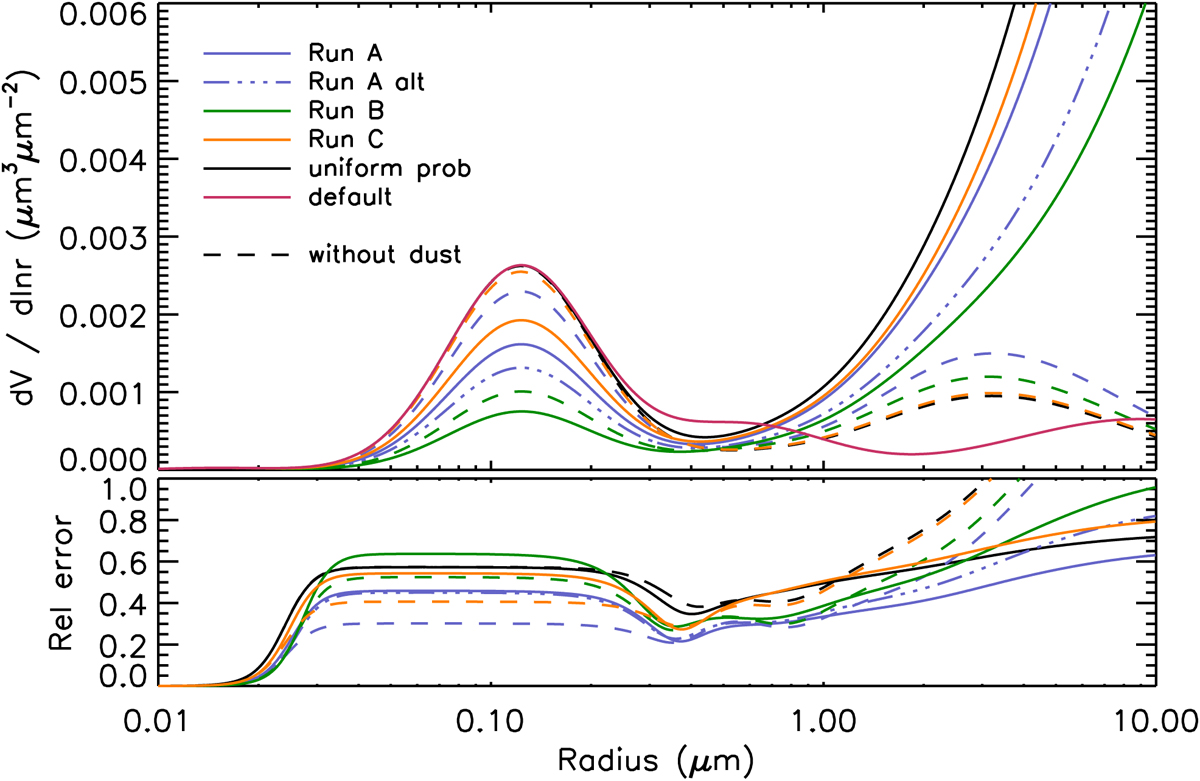
Top panel: most likely column-integrated volume densities of aerosol particles as a function of radius for Run A (blue, solid), Run A alternate (blue, dot-dashed), Run B (green) and Run C (orange). The volume density with uniform probabilities (black) and the distribution used in the current sky background model (default, pink) are also shown. The same analysis, but without the dust particles is shown for all three runs and with uniform probability (dashed). Bottom panel: relative error, given by σx/ < x >.
Current usage metrics show cumulative count of Article Views (full-text article views including HTML views, PDF and ePub downloads, according to the available data) and Abstracts Views on Vision4Press platform.
Data correspond to usage on the plateform after 2015. The current usage metrics is available 48-96 hours after online publication and is updated daily on week days.
Initial download of the metrics may take a while.