Fig. 1.
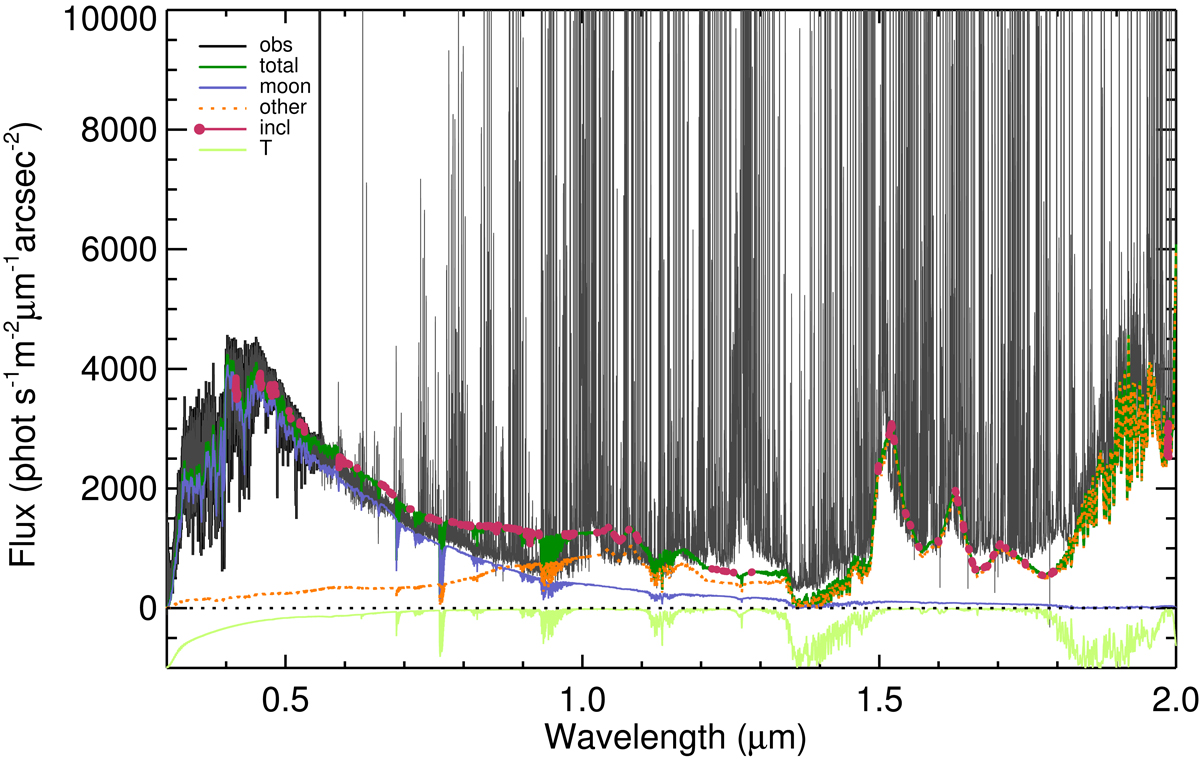
Example spectrum for the scattered moonlight determination. The observed spectrum (dark gray) was taken during Run B at ρ = 45°. Overlaid is an example of the current total sky background model (green) with the sky lines removed for clarity. Also shown are the inclusion regions for the analysis (pink filled circles). The scattered moonlight model (blue) and the other model components (orange dotted), except the sky lines, are also shown. Below the dotted black line is the transmission curve (light green).
Current usage metrics show cumulative count of Article Views (full-text article views including HTML views, PDF and ePub downloads, according to the available data) and Abstracts Views on Vision4Press platform.
Data correspond to usage on the plateform after 2015. The current usage metrics is available 48-96 hours after online publication and is updated daily on week days.
Initial download of the metrics may take a while.