Fig. 1
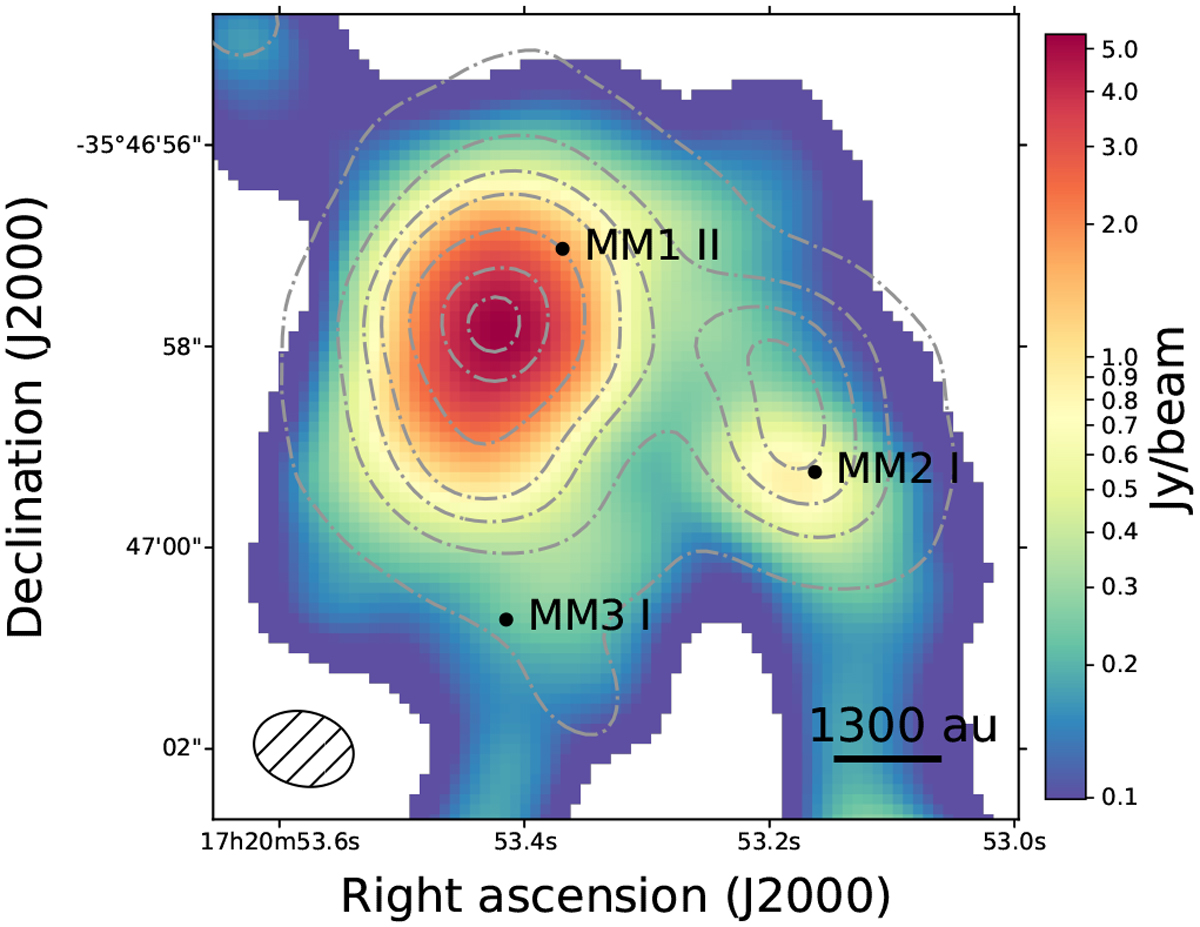
1 mm continuum image of the NGC 6334I region with the velocity integrated intensity map of the 13CH3CN transitionat 303.610 GHz overlaid in grey contours (levels are [3, 20, 40, 60, 100, 150, 180]σ with σ = 0.07 Jy beam−1 km s−1). Pixels with values less than 1% of the peak intensity have been masked out. The locations at which spectra have been extracted are marked for each region. The synthesised beam (~1300 × 962 au) is shown in the bottom left corner.
Current usage metrics show cumulative count of Article Views (full-text article views including HTML views, PDF and ePub downloads, according to the available data) and Abstracts Views on Vision4Press platform.
Data correspond to usage on the plateform after 2015. The current usage metrics is available 48-96 hours after online publication and is updated daily on week days.
Initial download of the metrics may take a while.