Fig. 9
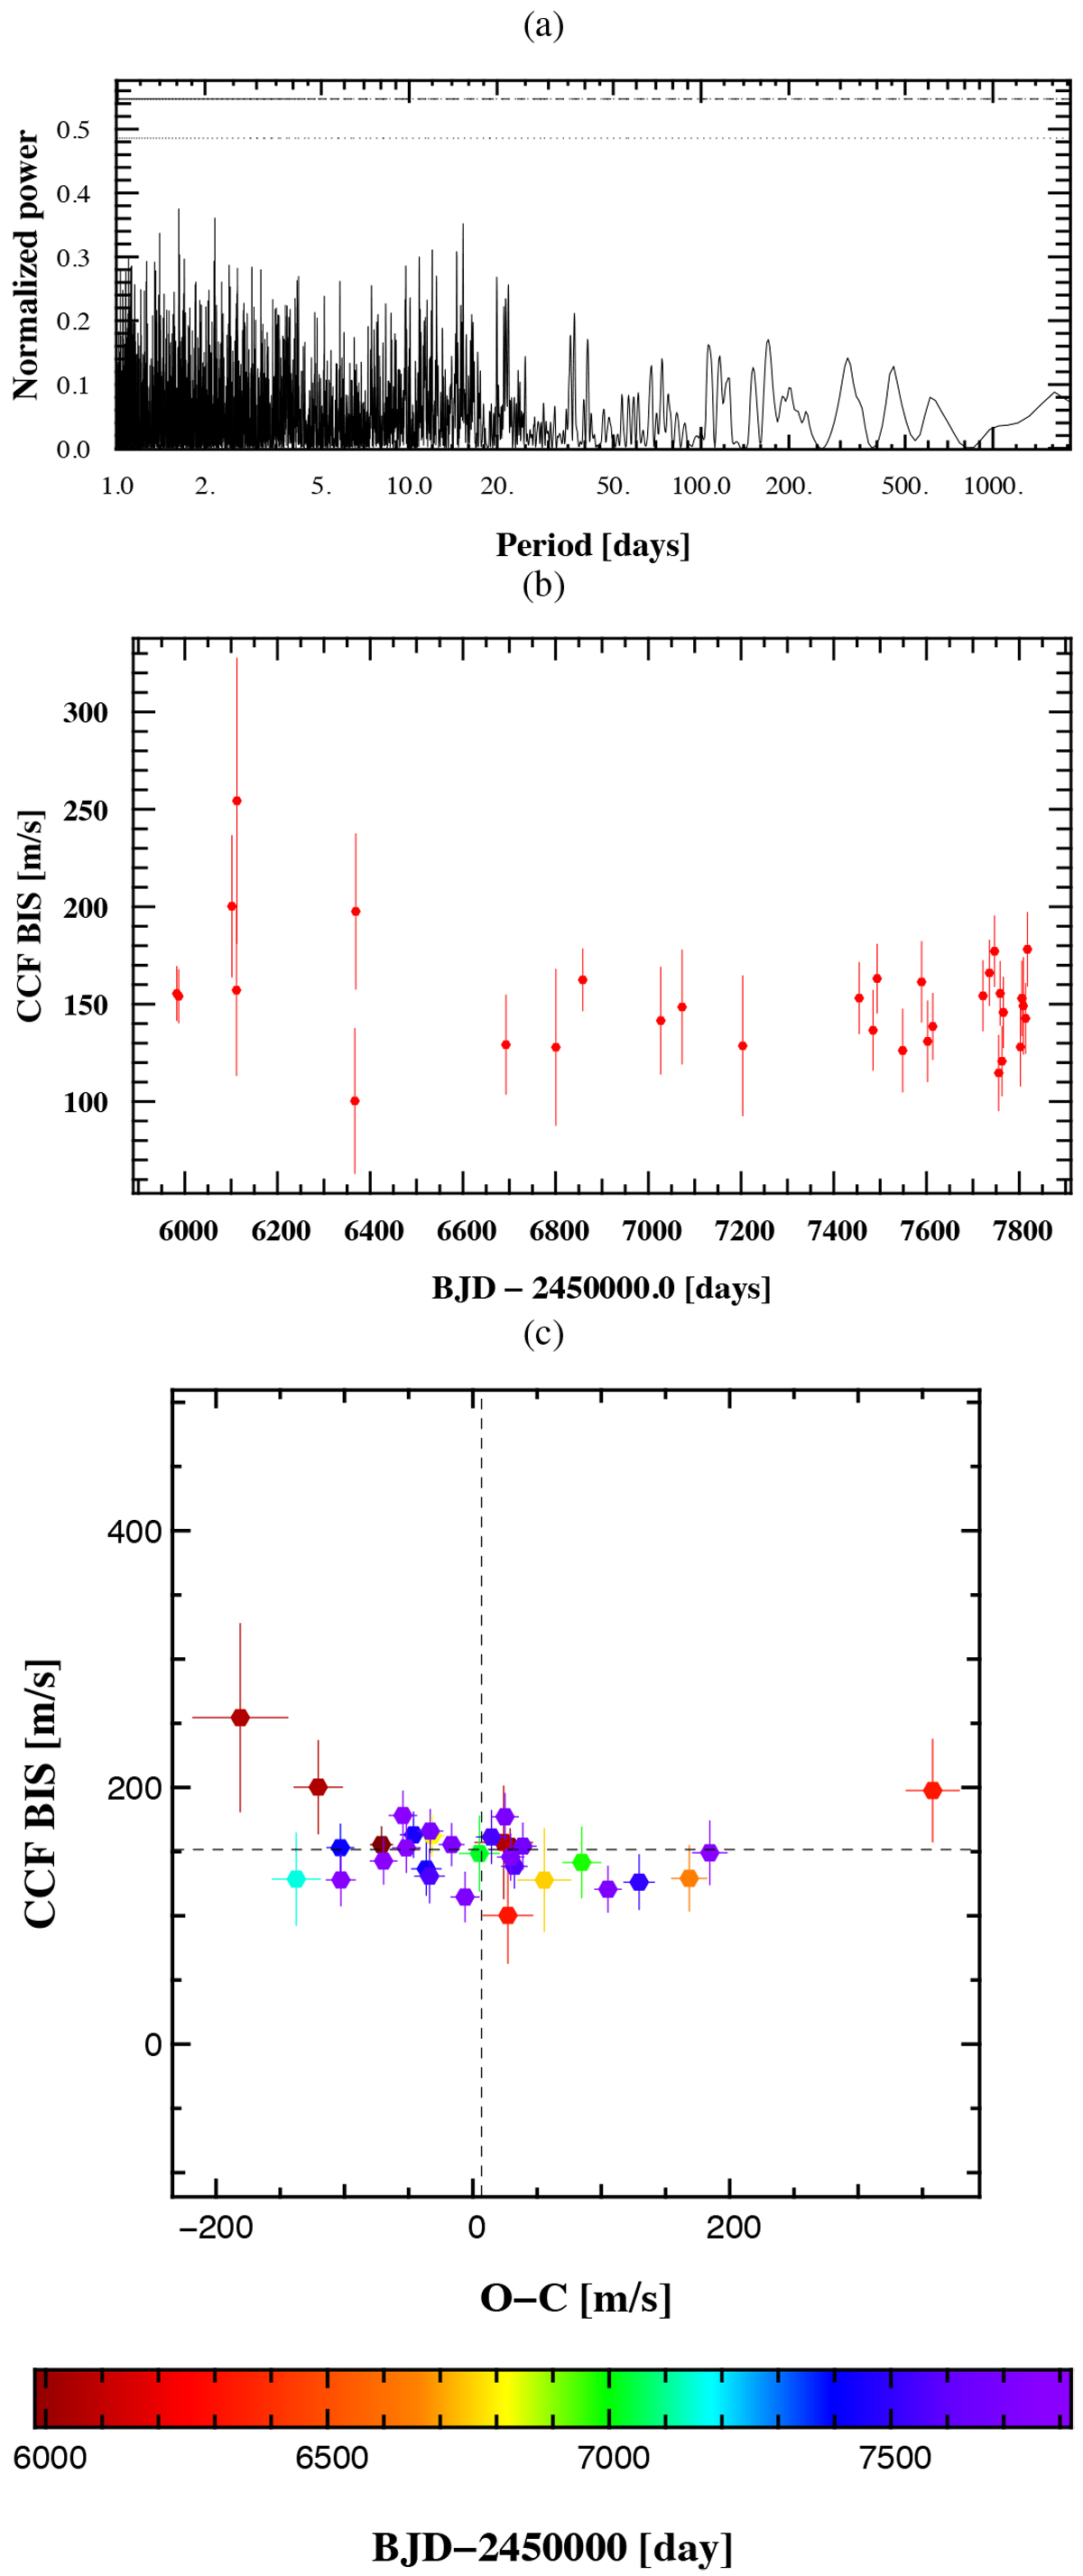
Data for the EBLM J1146-42 triple star system. Panel a: periodogram of the residuals to a double Keplerian fit. The dash-dotted horizontal line at the top of the plot corresponds to a false alarm probability of 1%. The dotted line below is for 10%. There is therefore no statistically significant periodicity within the residuals. See Appendix B for more plots for this system. Panel b: bisector for each radial velocity measurement. Panel c: radial velocity residuals to a double Keplerian fit as a function of the bisector. A negative correlation would be a marker of stellar activity, but is not apparent here.
Current usage metrics show cumulative count of Article Views (full-text article views including HTML views, PDF and ePub downloads, according to the available data) and Abstracts Views on Vision4Press platform.
Data correspond to usage on the plateform after 2015. The current usage metrics is available 48-96 hours after online publication and is updated daily on week days.
Initial download of the metrics may take a while.