Fig. 8
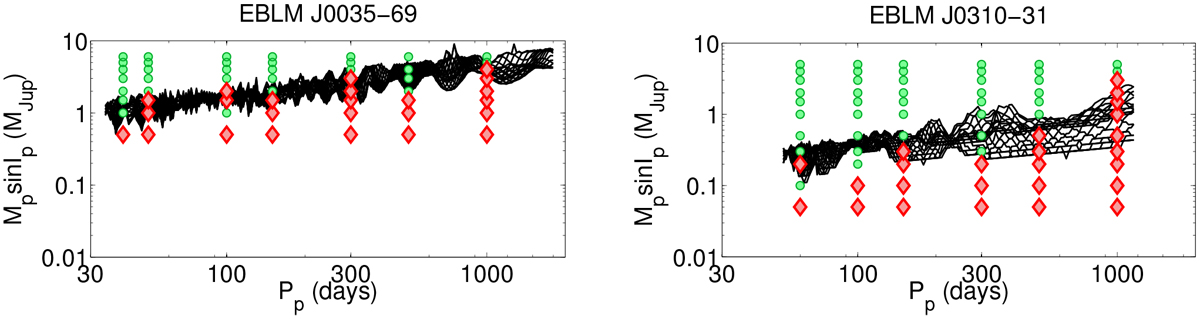
Detection limit curves in black for two targets in the BEBOP programme: J0035-69(left panel) and J0310-31 (right panel). Each curve represents the smallest mc sin Ic for a putative circumbinary planet at a given period, according to the periodogram measure of detectability described in Sect. 8.2. For each target there are 20 black curves, one for each of the tested orbital phases of the injected planet. At seven discrete periods a series of tests were run to recover n-body simulated circumbinary planets with the YORBIT genetic algorithm. At these periods a green circle indicates a successful recovery, whereas a red diamond indicates a failure.
Current usage metrics show cumulative count of Article Views (full-text article views including HTML views, PDF and ePub downloads, according to the available data) and Abstracts Views on Vision4Press platform.
Data correspond to usage on the plateform after 2015. The current usage metrics is available 48-96 hours after online publication and is updated daily on week days.
Initial download of the metrics may take a while.