Fig. 5
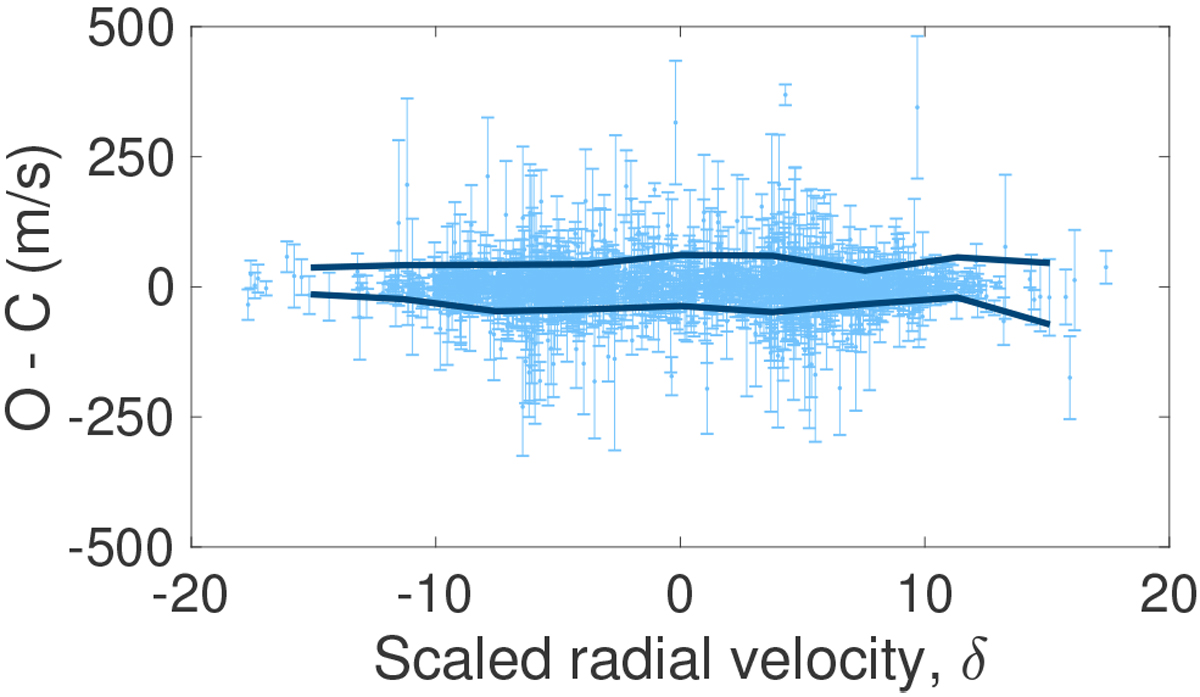
Radial velocity residuals (“Observed minus Calculated” or O–C for short) of the best-fitting model to all BEBOP binaries forall 1519 observations, stacked on top of each other as a function of the scaled radial velocity value δ, defined according to Eq. (7). The δ value says how far the observed radial velocity observation was from the systemic velocity, scaled by the average FWHM for that target. The two roughly horizontal dark blue lines are the root mean squared (RMS) values of the residuals, split into positive and negative values. If the RMS were maximised near δ = 0 then this would be indicative of wide-spread spectral contamination from the secondary star, but this is evidently not the case.
Current usage metrics show cumulative count of Article Views (full-text article views including HTML views, PDF and ePub downloads, according to the available data) and Abstracts Views on Vision4Press platform.
Data correspond to usage on the plateform after 2015. The current usage metrics is available 48-96 hours after online publication and is updated daily on week days.
Initial download of the metrics may take a while.