Fig. 7
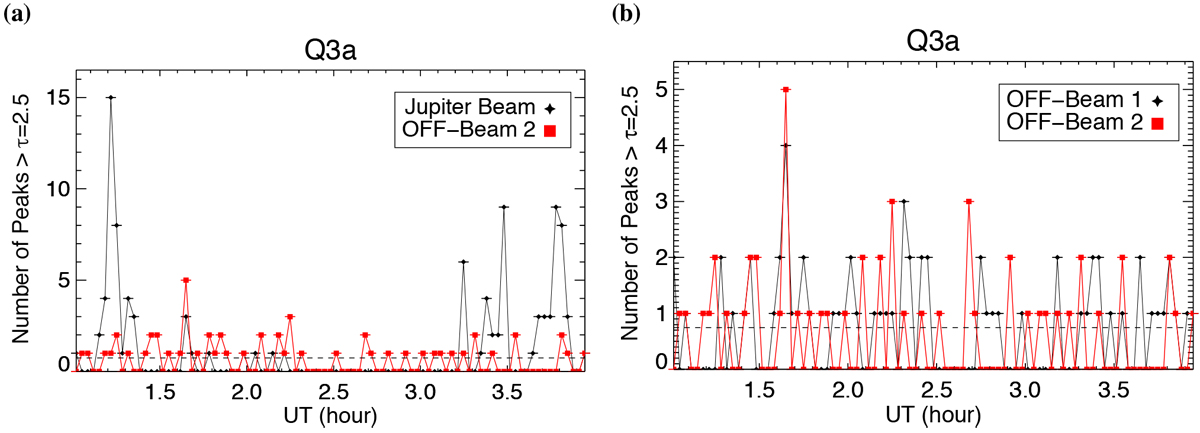
Comparison of the observable quantity Q3a between the ON-beam (Jupiter) and OFF-beam 2 (panel a) and the 2 OFF-beams (panel b) in Stokes-V (|V′ |) for a scaling value α = 10−4 and threshold τ = 2.5σ. See Sect. 4.3 for a detailed description of Q3a. For all plots the black lines and the red lines correspond to two different beams. The dashed line is the mean of the derived Q values from 10 000 different Gaussian distributions with the same length as the time interval (TI). Jupiter’s emission is mainly localized between 1.2–1.4 UT and 3.2–3.9 UT, whereas the bright emission at 1.7 UT can be seen in both OFF beams.
Current usage metrics show cumulative count of Article Views (full-text article views including HTML views, PDF and ePub downloads, according to the available data) and Abstracts Views on Vision4Press platform.
Data correspond to usage on the plateform after 2015. The current usage metrics is available 48-96 hours after online publication and is updated daily on week days.
Initial download of the metrics may take a while.