Fig. 6
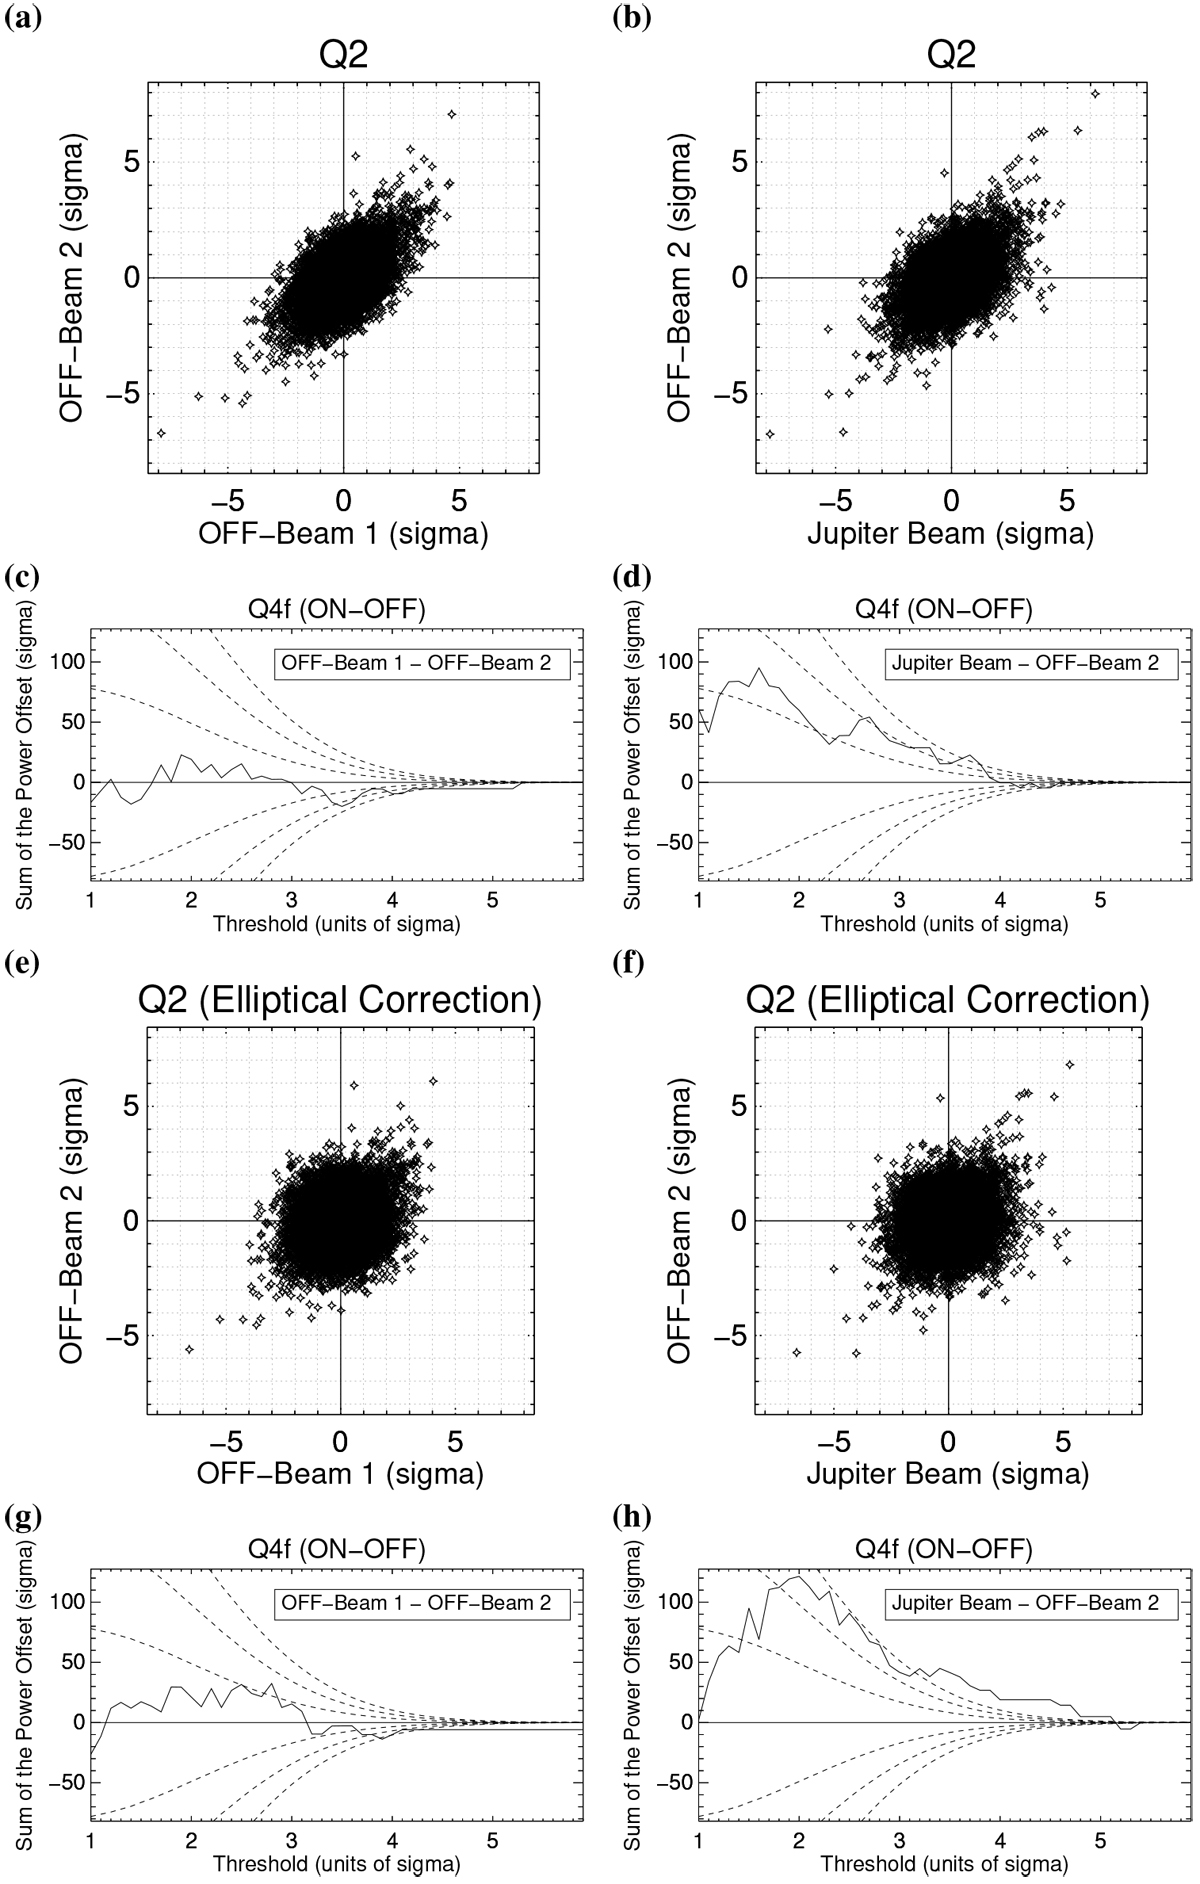
Plots of Q2 and Q4f (Power Offset) showing the detection limit for Stokes-I (α = 10−3.5) for thefrequency range 50–60 MHz. Panels a and b: Q2 before elliptical correction. Panels c and d: Q4f difference of the two beams before elliptical correction. Panels e and f: Q2 after elliptical correction. Panels g and h: Q4f difference of the two beams after elliptical correction. The comparison of the two OFF-beams from Obs #2 can be found in the left column (panels a, c, e, g) and the comparison of ON-beam (Jupiter) vs. OFF-beam 2 can be found in the right column (panels b, d, f, h). The dashed lines for panels c, d, g, and h are the 1, 2, 3 σ statistical limits derived from two different Gaussian distributions (each run 10 000 times). Panel h: excess of ON vs. OFF points at ≥2 σ statistical significance for signals up to a threshold of 4σ. For comparison, in panel g all the excess points are mostly below the 1σ statistical significance level. We find by performing Gaussian simulations that the probability to obtain a curve like panel g is ~99%, whereas the probability to reproduce a curve like panel h is ~10−4.
Current usage metrics show cumulative count of Article Views (full-text article views including HTML views, PDF and ePub downloads, according to the available data) and Abstracts Views on Vision4Press platform.
Data correspond to usage on the plateform after 2015. The current usage metrics is available 48-96 hours after online publication and is updated daily on week days.
Initial download of the metrics may take a while.