Fig. 3
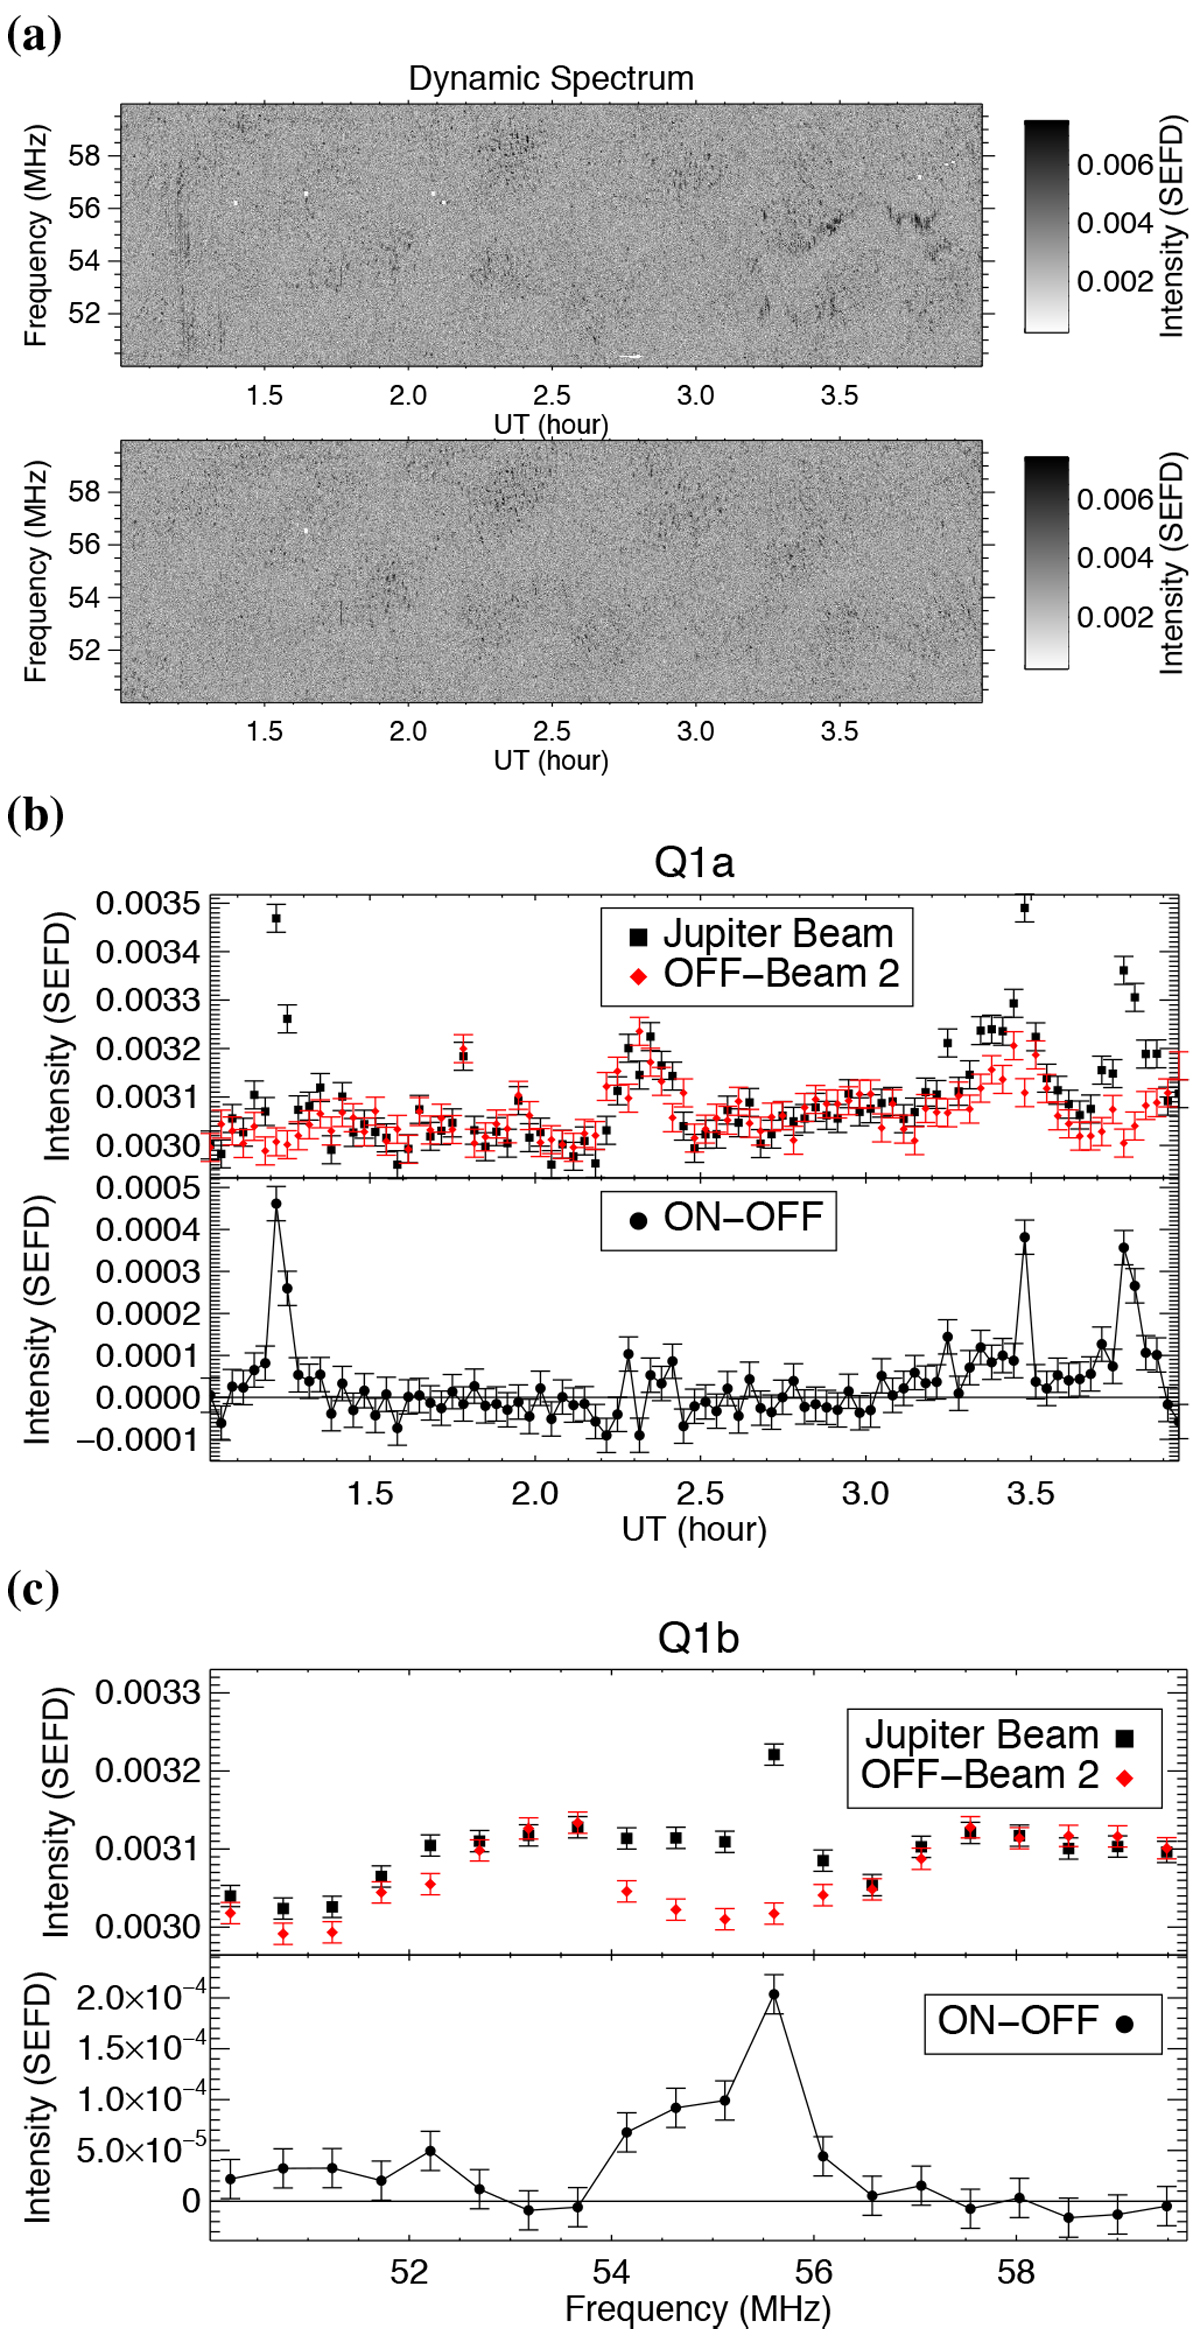
Dynamic spectra and extended emission observable Q1 in Stokes-V (|V′ |) for a scaling parameter of α = 10−4.
Panels a: dynamic spectra for the ON-beam (top panel) and the OFF-beam (bottom panel). Panel b: Q1a (time-series integrated over all frequencies). Panel c: Q1b (integrated spectrum summed over all times). See Sect. 4.3 for a detailed description of each observable. For all plots the black squares are the ON-beam, red diamonds are the OFF-beam, and black circles are the difference between beams. The error bars in panels b and c were calculated assuming pure Gaussian noise (![]() ).
).
Current usage metrics show cumulative count of Article Views (full-text article views including HTML views, PDF and ePub downloads, according to the available data) and Abstracts Views on Vision4Press platform.
Data correspond to usage on the plateform after 2015. The current usage metrics is available 48-96 hours after online publication and is updated daily on week days.
Initial download of the metrics may take a while.