Fig. 2
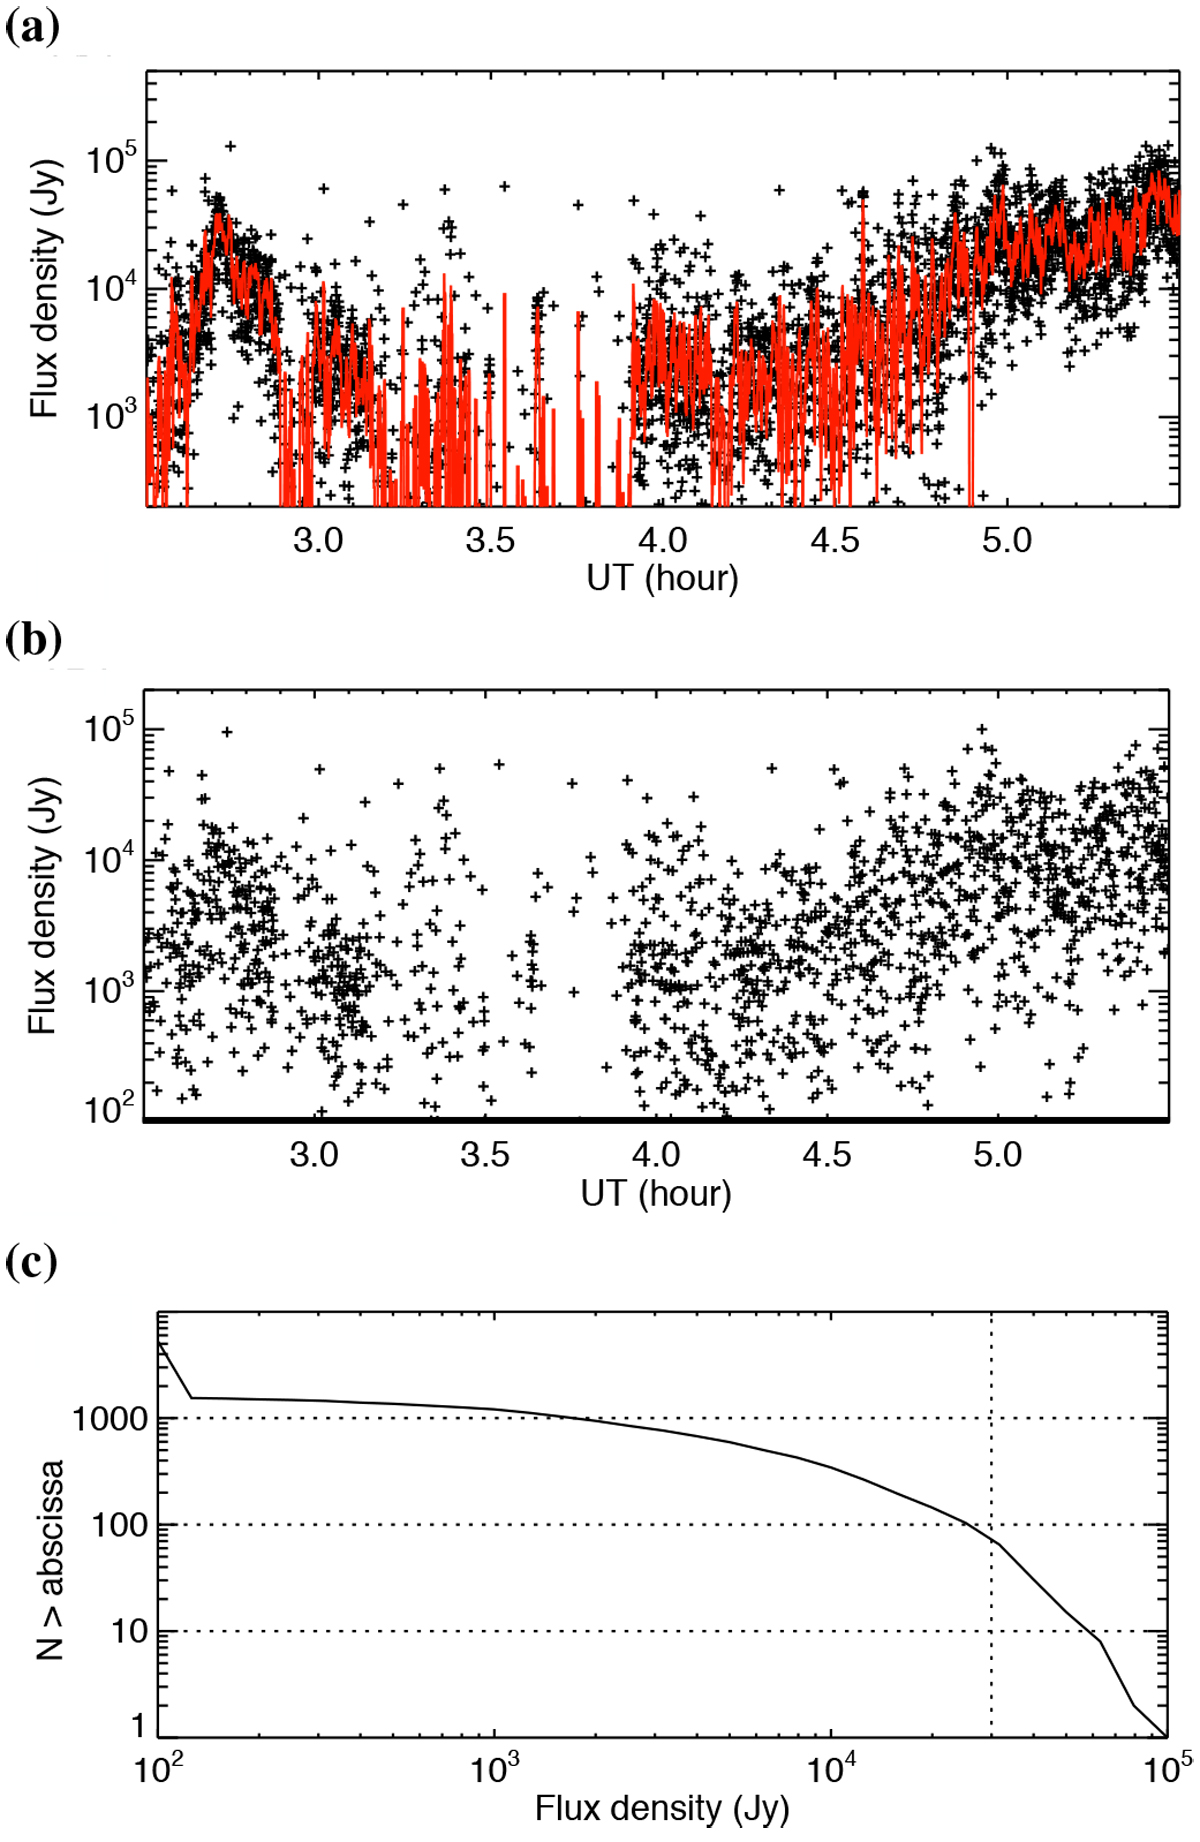
Panel a: calibrated flux density of the Jupiter emission detected on 2017/02/11 between 02:30 and 05:30 UT with the NDA, averaged over the range of 15–25 MHz after background subtraction. Black “+” symbols are the measurements at 1 s time resolution, whereas the red line is a running average over 10 s. Panel b: high-pass filtered flux densities obtained by subtracting the 10 s average from 1 s measurements. Only values ≥100 Jy are displayed. Panel c: cumulative distribution function of the values of panel b.
Current usage metrics show cumulative count of Article Views (full-text article views including HTML views, PDF and ePub downloads, according to the available data) and Abstracts Views on Vision4Press platform.
Data correspond to usage on the plateform after 2015. The current usage metrics is available 48-96 hours after online publication and is updated daily on week days.
Initial download of the metrics may take a while.