Fig. A.3.
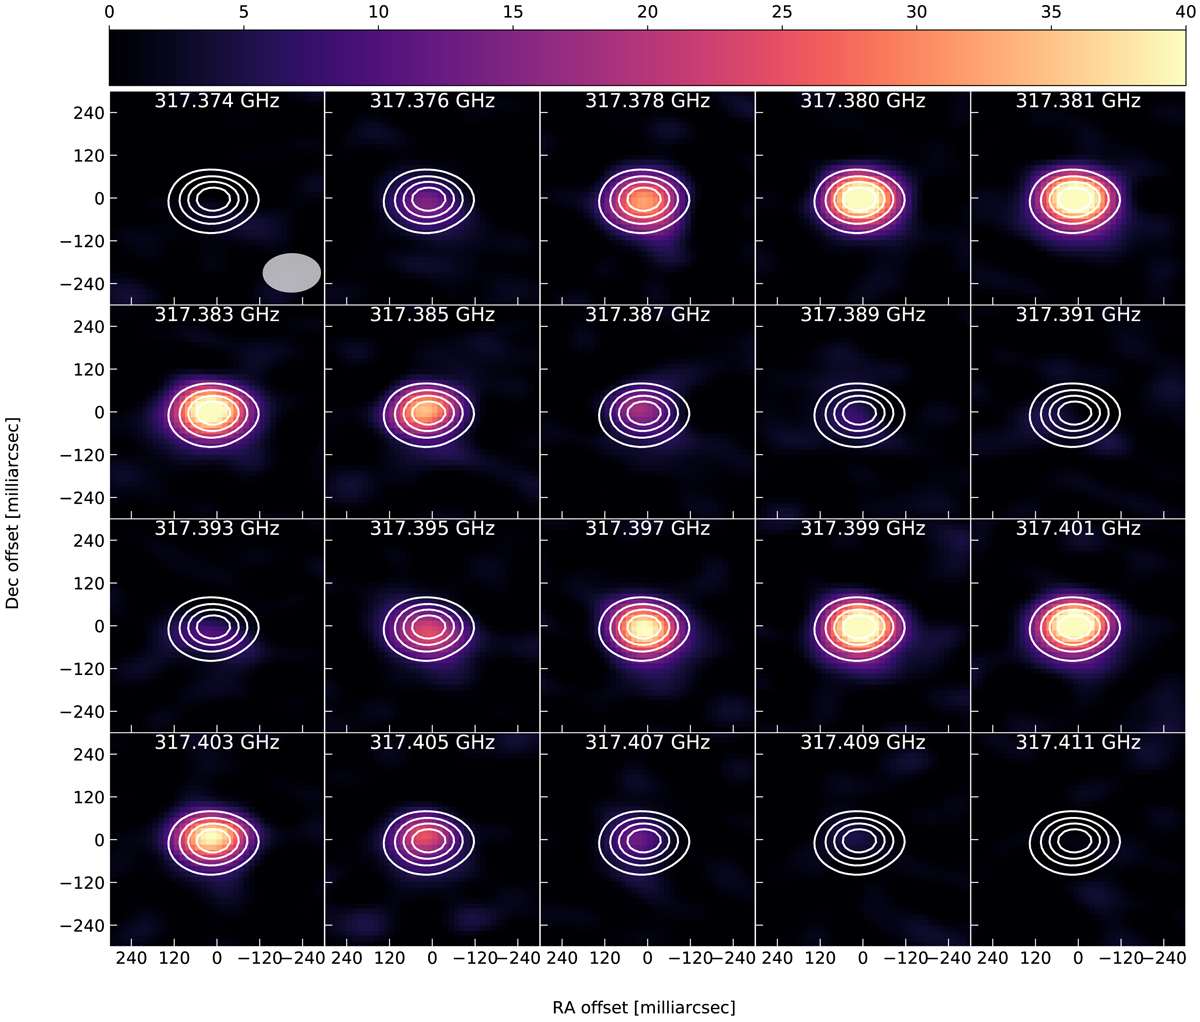
Channel map of the Λ-doubling lines within level v, NJ = 0, 1633/2 observed towards R Dor. The colour map gives the line intensity in mJy beam−1 and the contours show the continuum at levels of 20%, 40%, 60%, and 80% of the peak. We give the observed frequencies not corrected for the source systemic velocity. The full width at half maximum of the reconstructing beam is shown by the grey ellipse in the upper left panel.
Current usage metrics show cumulative count of Article Views (full-text article views including HTML views, PDF and ePub downloads, according to the available data) and Abstracts Views on Vision4Press platform.
Data correspond to usage on the plateform after 2015. The current usage metrics is available 48-96 hours after online publication and is updated daily on week days.
Initial download of the metrics may take a while.