Fig. A.2.
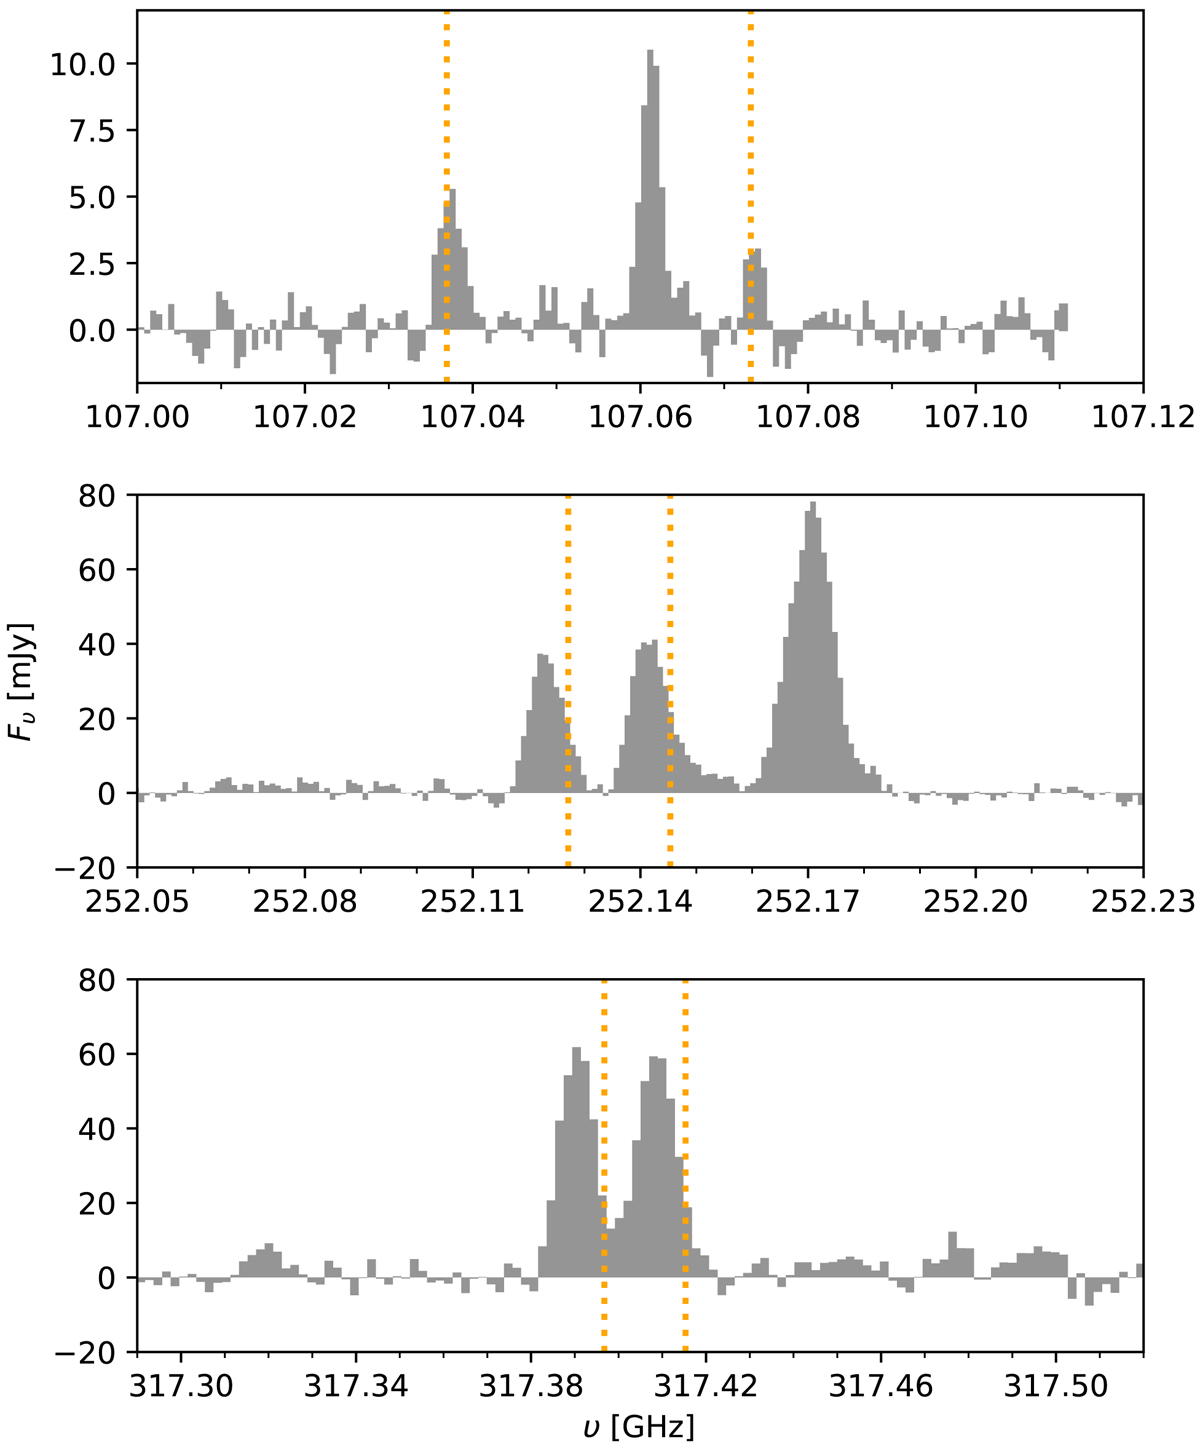
Λ-doubling lines observed towards R Dor that were used in the population diagram shown in Fig. 1. The spectra are given in rest frequencies using the υLSR of R Dor of 8.5 km s−1 (see text). The vertical dotted orange lines show the predicted line frequencies from the JPL catalogue. The aperture used was twice the size of the band 7 beam. Other lines can be seen in the displayed spectra, which we identified as follows: top panel, the JKa, Kc = 273, 25 − 264, 22 SO2 line (rest frequency: 107.060 GHz); and middle panel, v, JKa, Kc = v1, 74, 3 − 2v2, 85, 4 H2O line (tentative identification, rest frequency: 252.172 GHz).
Current usage metrics show cumulative count of Article Views (full-text article views including HTML views, PDF and ePub downloads, according to the available data) and Abstracts Views on Vision4Press platform.
Data correspond to usage on the plateform after 2015. The current usage metrics is available 48-96 hours after online publication and is updated daily on week days.
Initial download of the metrics may take a while.