Fig. A.1.
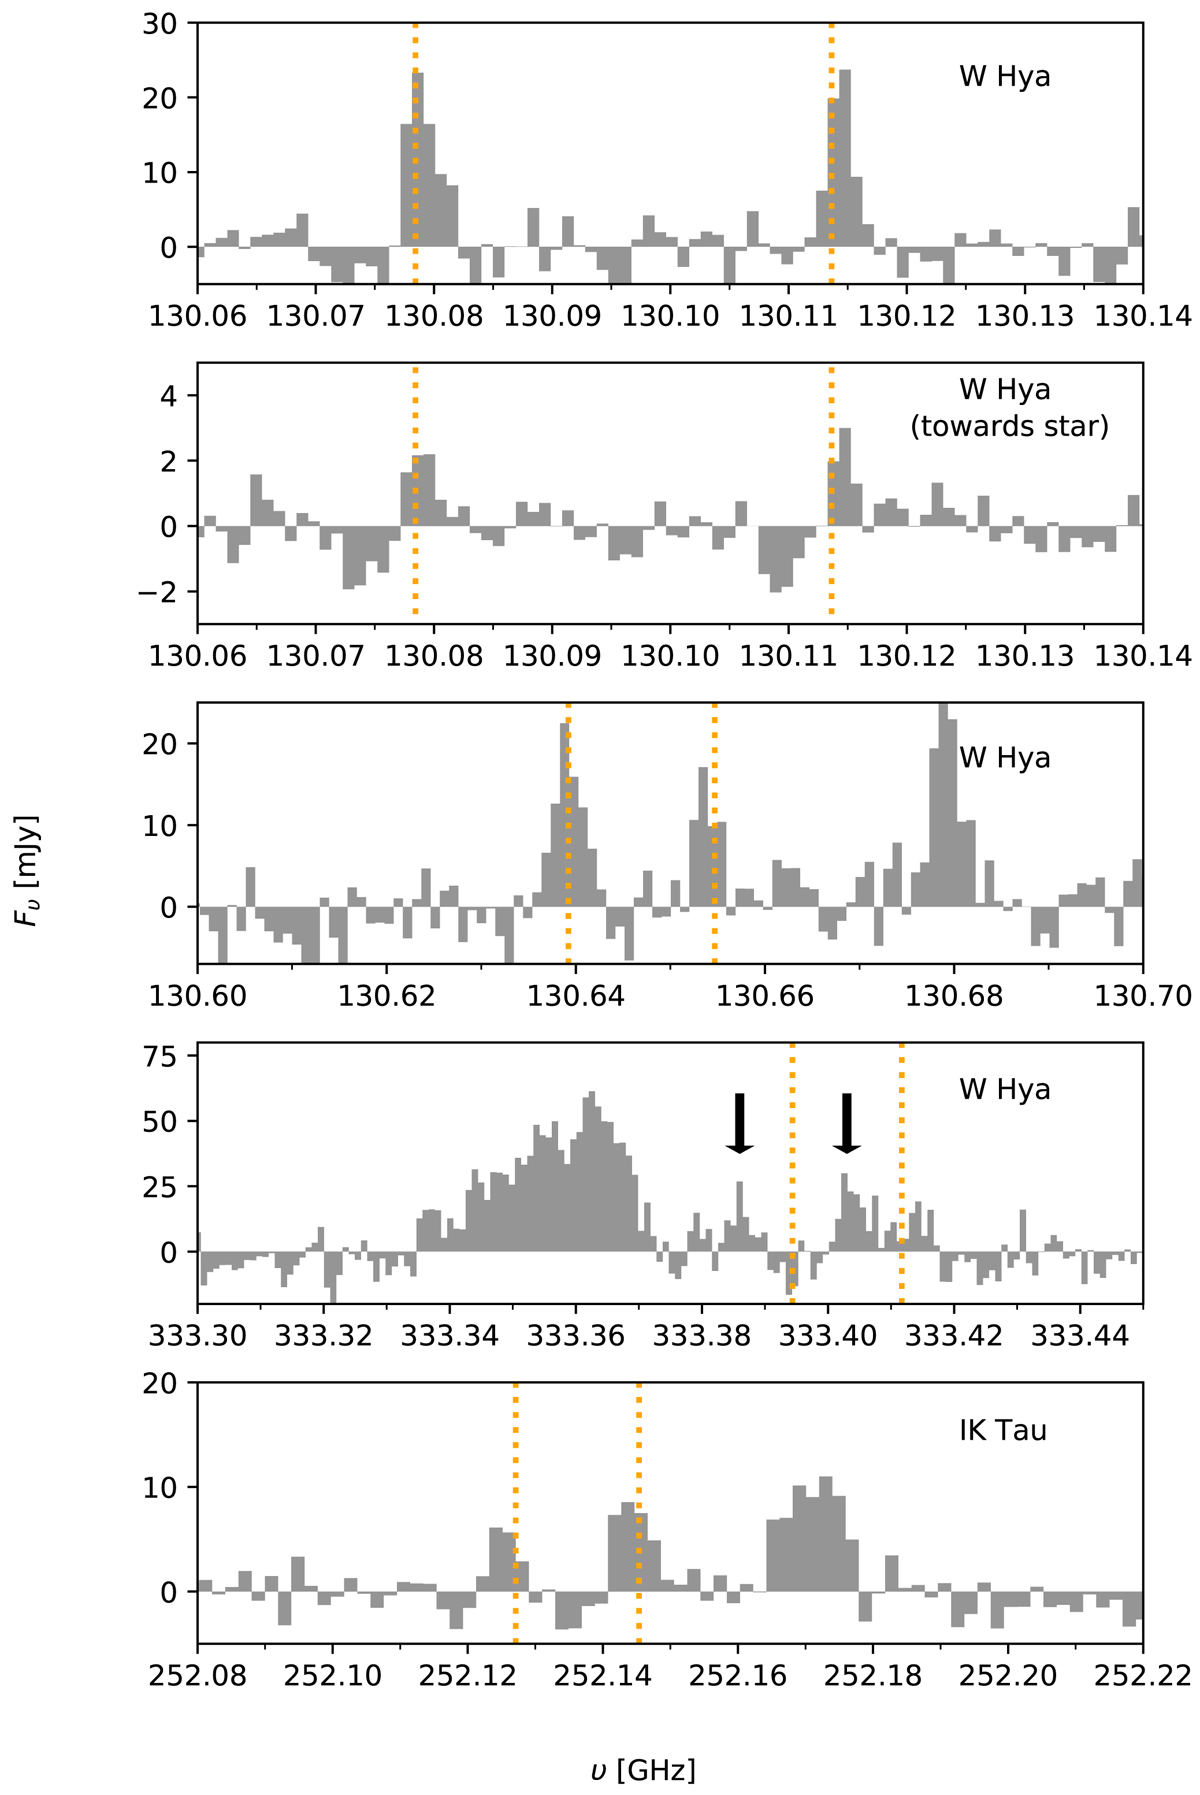
Λ-doubling lines observed towards W Hya (used in the population diagram shown in Fig. 1) and IK Tau. The spectra are given in rest frequencies using the υLSR of W Hya (39.2 km s−1) and IK Tau (33.8 km s−1). The vertical dotted orange lines show the predicted line frequencies from the JPL catalogue. The arrows in the second panel from the bottom mark the lines identified as belonging to the OH molecule. The lines were extracted from the large region described in the text for W Hya and from within the central beam of the observations for IK Tau. Other lines can be seen in the displayed spectra, which we identified as follows: middle panel, the JKa, Kc = 4210, 32 − 439, 35 SO2 line (rest frequency 130.680 GHz); second panel from the bottom, a blend between JKa, Kc = 596, 54 − 587, 51 and 283, 25 − 274, 24 SO2 lines (rest frequencies 333.360 and 333.364 GHz, and possibly also a blend with one line of 34SO2 and a vibrationally excited line of SO2); and bottom panel, v, JKa, Kc = v1, 74, 3 − 2v2, 85, 4 H2O line (tentative identification, rest frequency: 252.172 GHz).
Current usage metrics show cumulative count of Article Views (full-text article views including HTML views, PDF and ePub downloads, according to the available data) and Abstracts Views on Vision4Press platform.
Data correspond to usage on the plateform after 2015. The current usage metrics is available 48-96 hours after online publication and is updated daily on week days.
Initial download of the metrics may take a while.