Fig. 2.
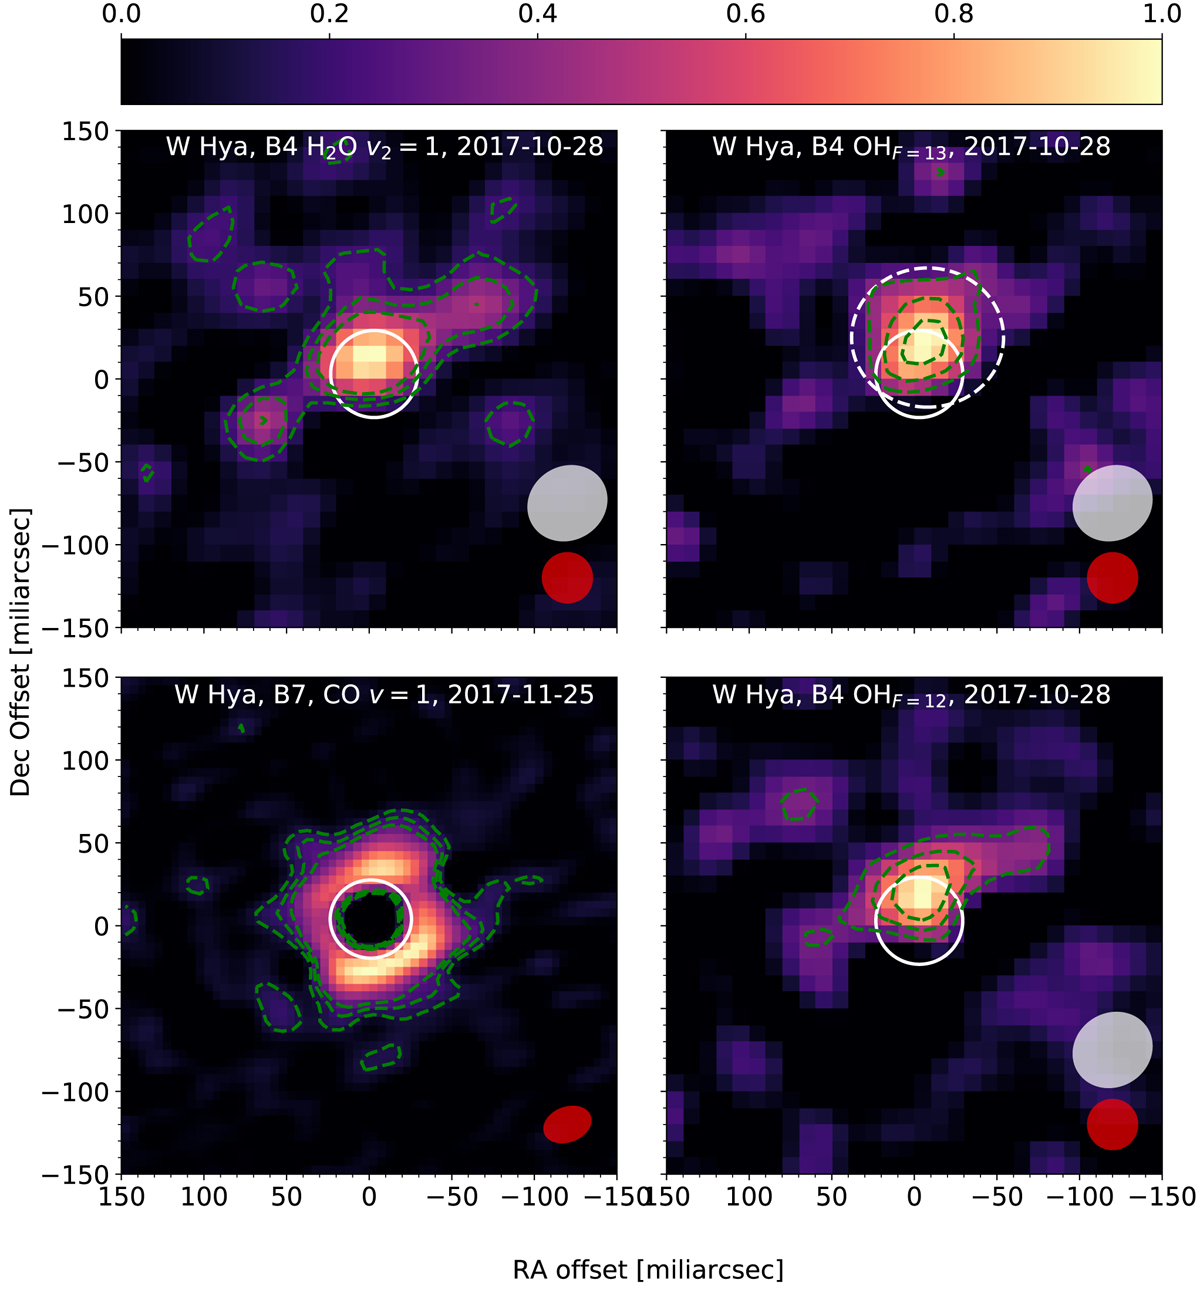
Emission regions observed towards W Hya of the lines v2 = 1, JKa, Kc = 88, 1 − 97, 2 and v2 = 1, JKa, Kc = 88, 0 − 97, 3 of H2O (sum of the two lines); v = 0, NJ = 1325/2 with F = 12 − 12 and F = 13 − 13 of OH; and v = 1, J = 3 − 2 of CO. The white contours show the size of the stellar disk at the appropriate frequencies (measured from fits of a uniform-disk source to the observed visibilities; Vlemmings et al., in prep.), the colour map shows the integrated line intensity normalised to its peak value, and the dashed green contours show emission 3, 5, and 7 times above the root mean square noise of the given image. The dashed white circle shows the extent of the small region (see text). The grey and red ellipses show the restoring beam of the continuum and line images, respectively. For the images in band 7, the two beams are equal.
Current usage metrics show cumulative count of Article Views (full-text article views including HTML views, PDF and ePub downloads, according to the available data) and Abstracts Views on Vision4Press platform.
Data correspond to usage on the plateform after 2015. The current usage metrics is available 48-96 hours after online publication and is updated daily on week days.
Initial download of the metrics may take a while.