Free Access
Fig. 1.
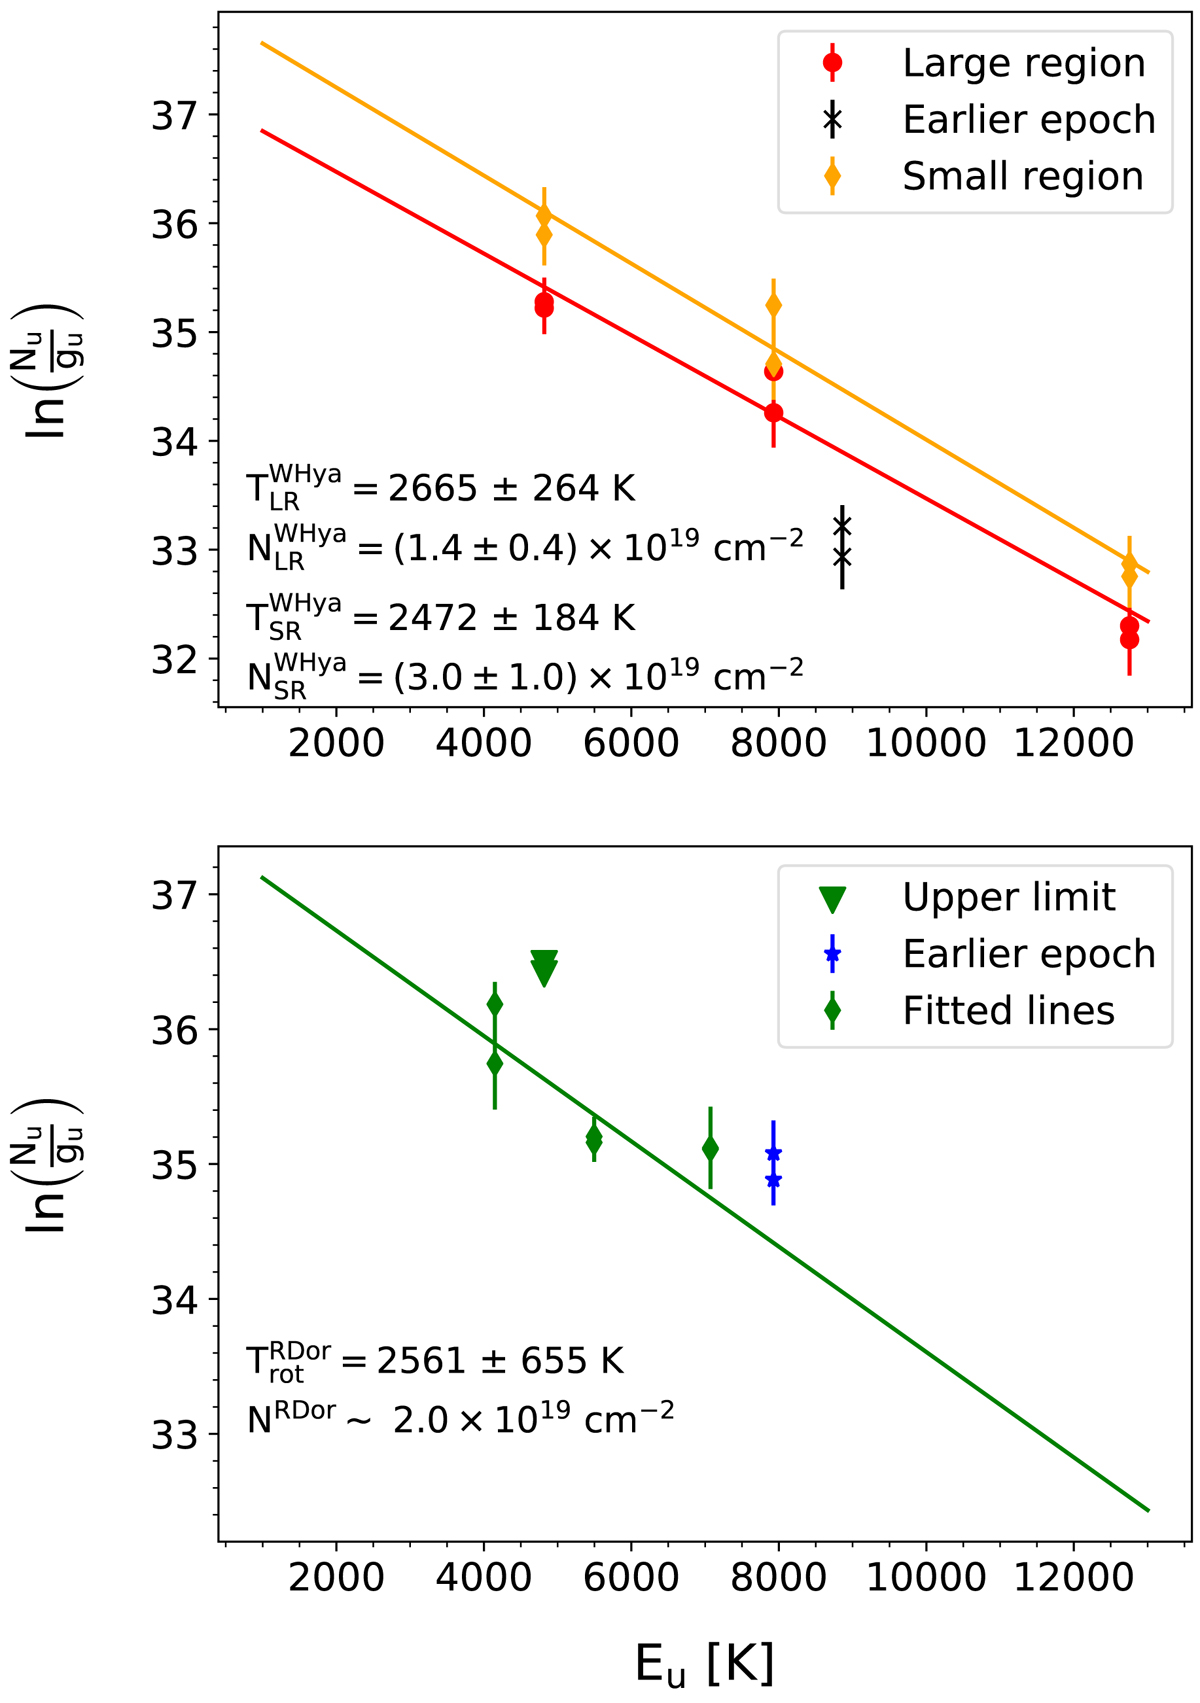
Population diagrams for lines detected towards W Hya (upper panel) and R Dor (lower panel). We performed the fit considering lines observed within approximately one month in time. For W Hya, we performed the population diagram analysis considering line fluxes extracted from two distinct regions, see text for details.
Current usage metrics show cumulative count of Article Views (full-text article views including HTML views, PDF and ePub downloads, according to the available data) and Abstracts Views on Vision4Press platform.
Data correspond to usage on the plateform after 2015. The current usage metrics is available 48-96 hours after online publication and is updated daily on week days.
Initial download of the metrics may take a while.