Fig. 5.
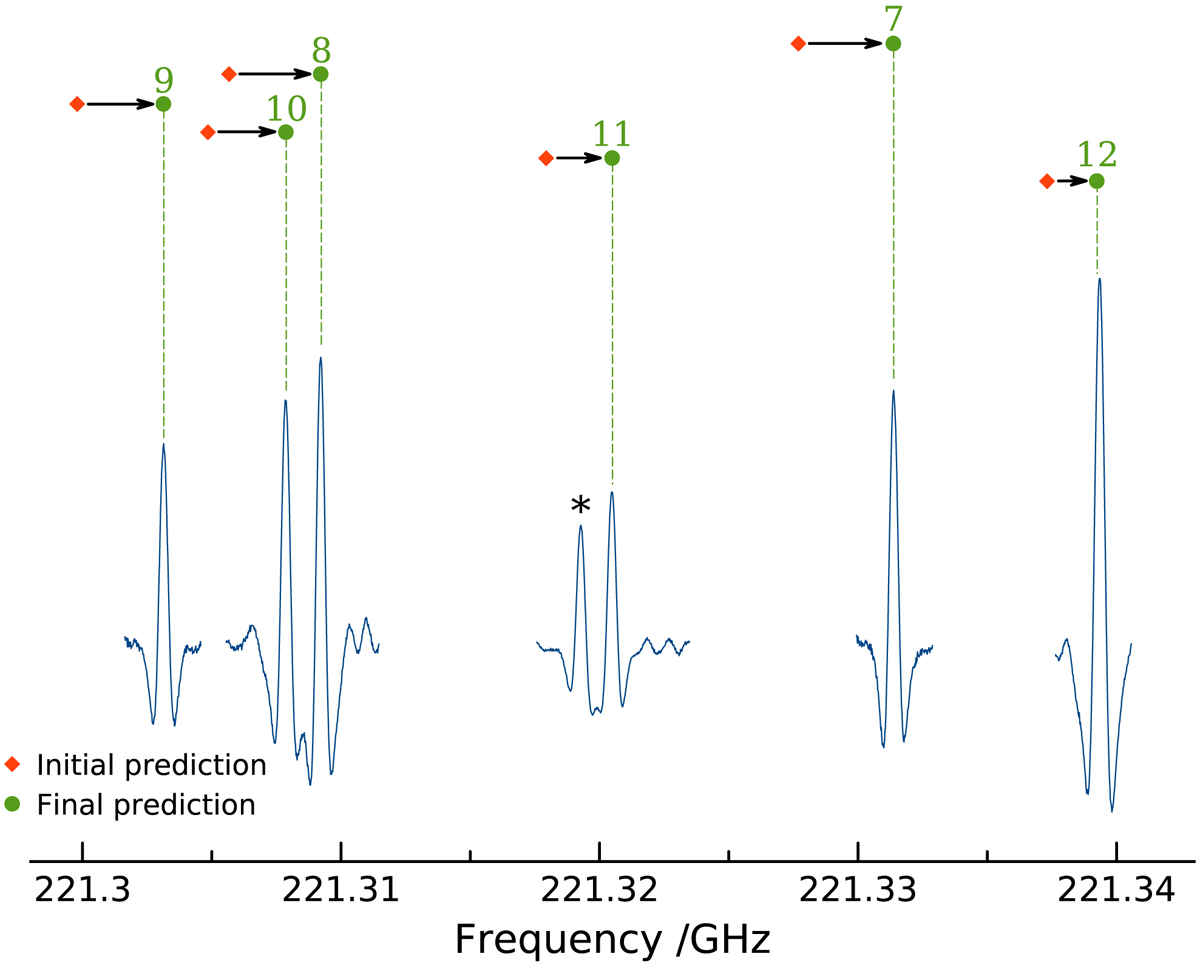
Individual transitions measured in the qR(19) branch of syn vinyl mercaptan and comparison between the initial (red diamonds) and final (green dots) predictions. The Ka value of each transition is indicated in green; the asymmetry splitting is not resolved for these lines. The transition labeled with an asterisk is unidentified. The line shape appears as a second derivative owing to the employed detection scheme.
Current usage metrics show cumulative count of Article Views (full-text article views including HTML views, PDF and ePub downloads, according to the available data) and Abstracts Views on Vision4Press platform.
Data correspond to usage on the plateform after 2015. The current usage metrics is available 48-96 hours after online publication and is updated daily on week days.
Initial download of the metrics may take a while.