Fig. 5
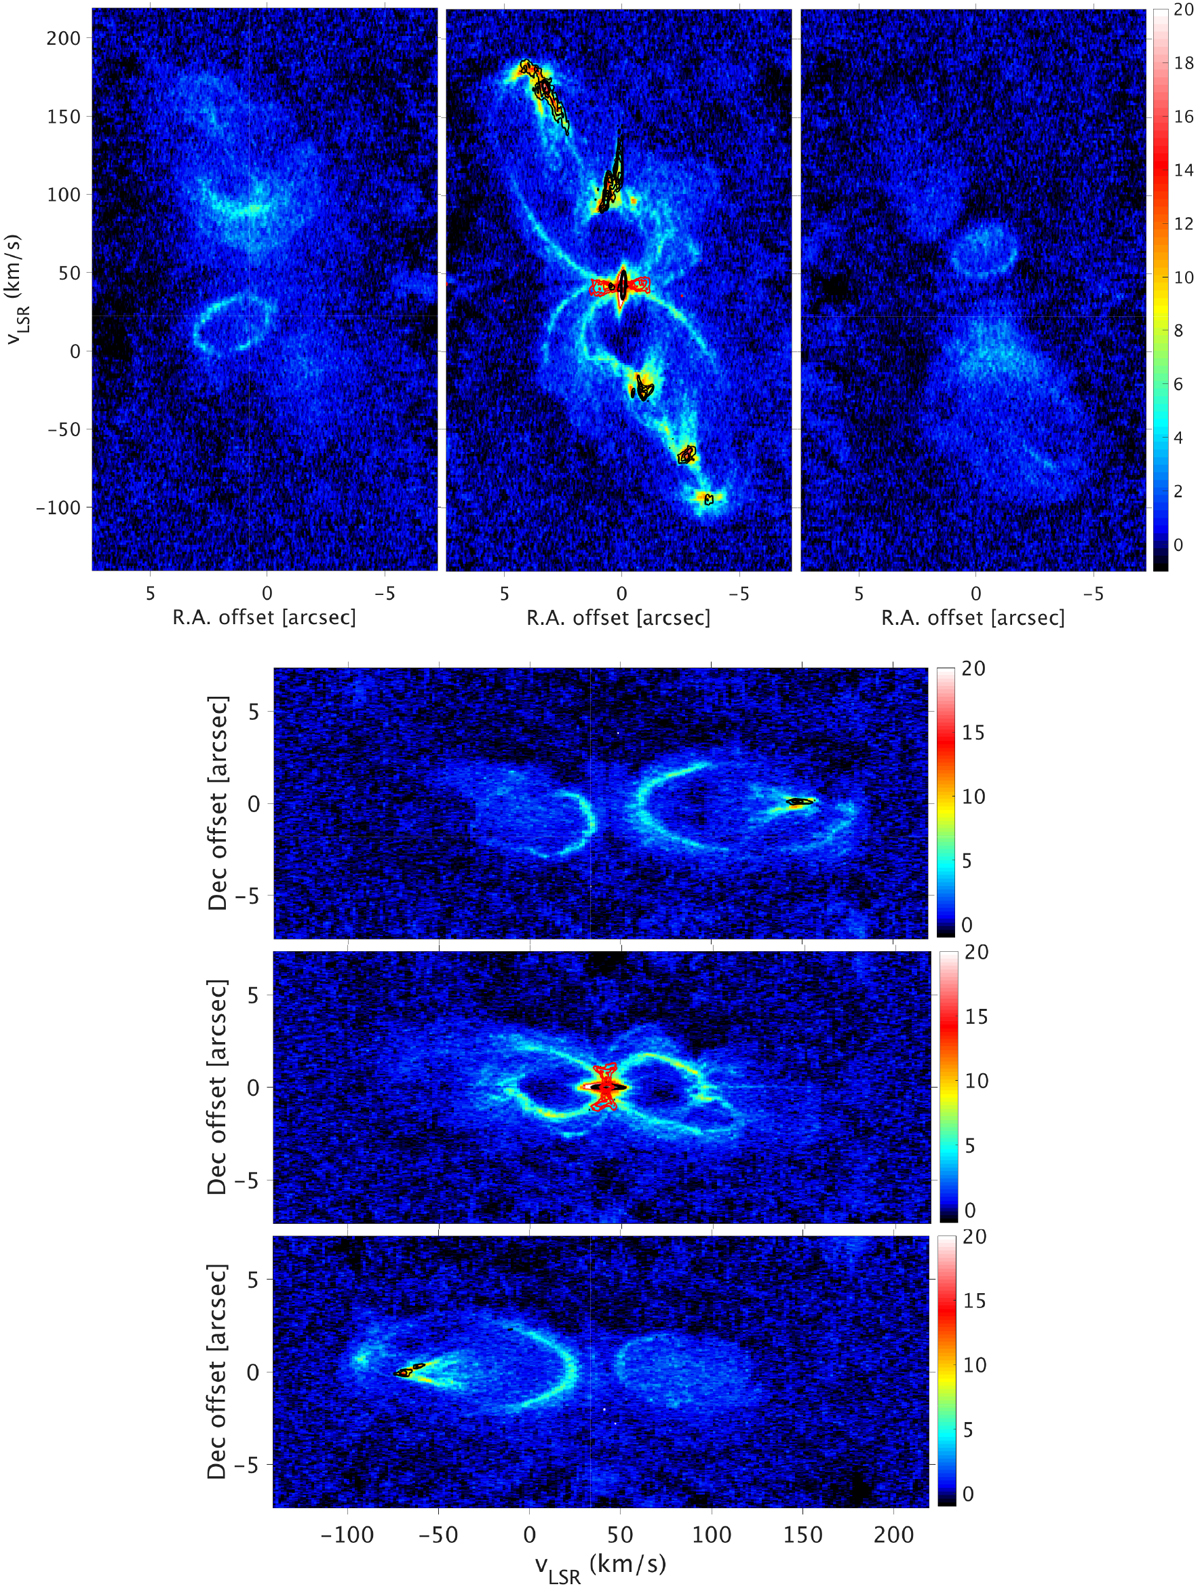
Upperpanels: PV-diagrams in the right ascension direction as seen in the CO(2–1; colour), SiO(5–4; black contours), and p-H2S(220 − 211; red contours) lines at declination offsets of 2.′′5 S (left panel), mid plane (middle panel), and 2.′′5 N (right panel). Lower panels: the same in the declination direction at right ascension offsets of 2.′′ 5 E (top panel), mid plane (middle panel), and 2.′′5 W (bottom panel). The flux scale is in mJy beam−1, and the contours start at 2 mJy beam−1 with a spacing of 2 mJy beam−1.
Current usage metrics show cumulative count of Article Views (full-text article views including HTML views, PDF and ePub downloads, according to the available data) and Abstracts Views on Vision4Press platform.
Data correspond to usage on the plateform after 2015. The current usage metrics is available 48-96 hours after online publication and is updated daily on week days.
Initial download of the metrics may take a while.