Fig. 3
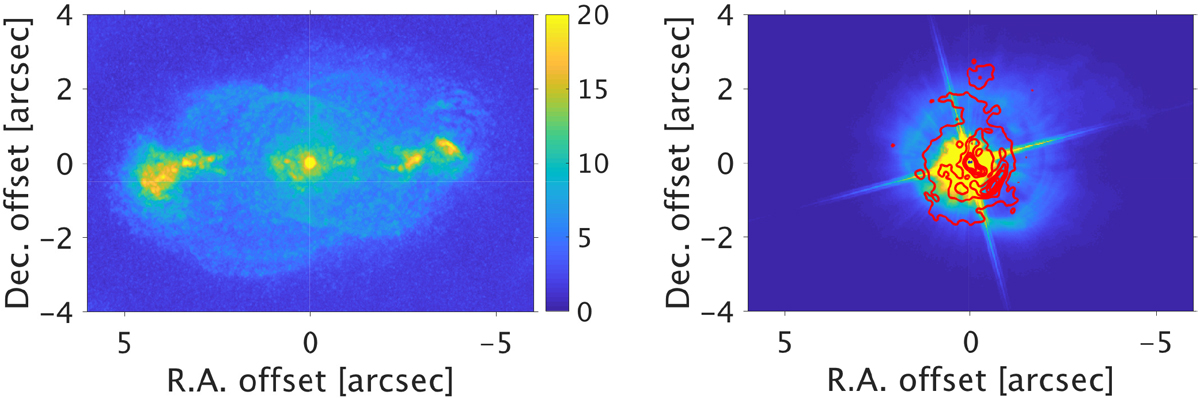
Left panel: CO(2–1) maximum-intensity image at 0.′′085 resolution. Right panel: 1.3 mm continuum image (red contours starting at 0.2 mJy beam−1 and with a spacing of 0.3 mJy beam−1) at 0.′′ 15 resolution overlaid an F606W HST image from Sahai et al. (2007). The latter has been shifted so that the diffraction cross coincides with the continuum peak. The CO line intensity peak at the centre coincides with the continuum peak within an uncertainty of about 0.′′ 01.
Current usage metrics show cumulative count of Article Views (full-text article views including HTML views, PDF and ePub downloads, according to the available data) and Abstracts Views on Vision4Press platform.
Data correspond to usage on the plateform after 2015. The current usage metrics is available 48-96 hours after online publication and is updated daily on week days.
Initial download of the metrics may take a while.