Free Access
Fig. A.2
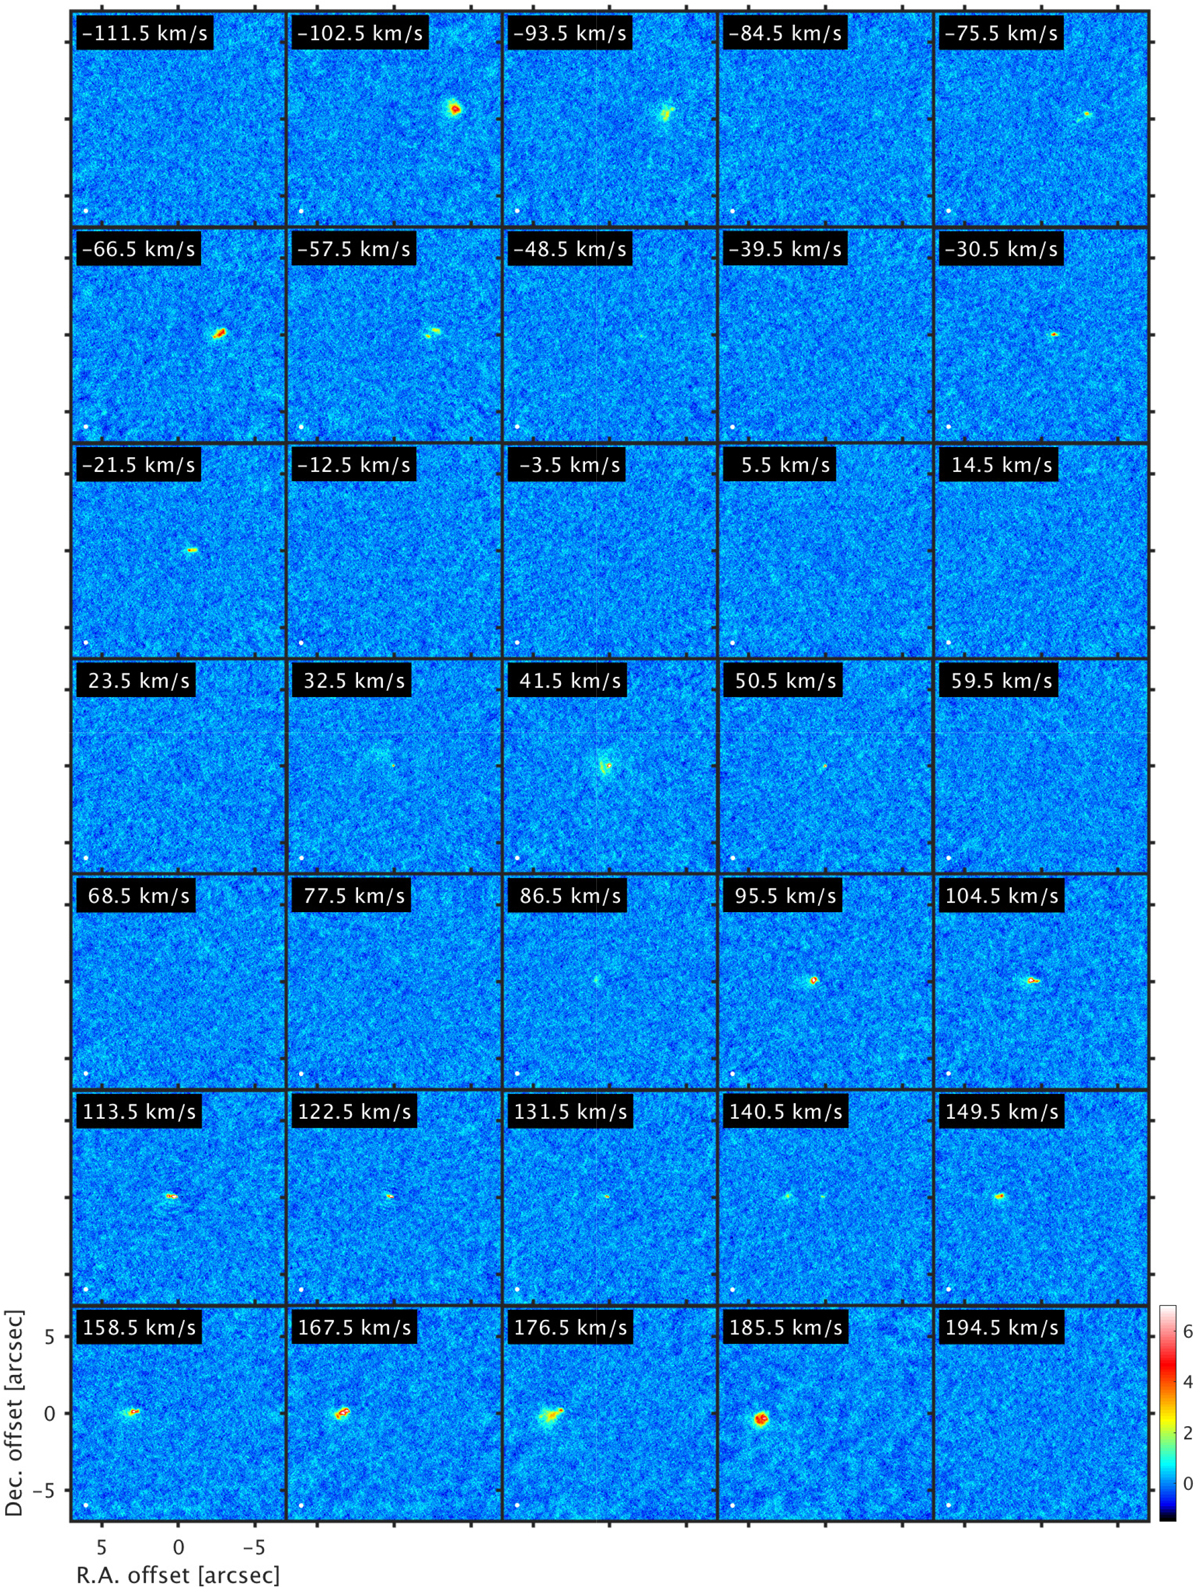
SiO(5–4) channel maps with a width and spacing of 9 km s−1 at a resolution of 0.′′085 (the beam is shown in the lower left corner of each panel). The flux scale is in mJy beam−1. Emission from the HVO (especially the bright spots) dominates for this line, but also emission from the CCS is present at the centre.
Current usage metrics show cumulative count of Article Views (full-text article views including HTML views, PDF and ePub downloads, according to the available data) and Abstracts Views on Vision4Press platform.
Data correspond to usage on the plateform after 2015. The current usage metrics is available 48-96 hours after online publication and is updated daily on week days.
Initial download of the metrics may take a while.