Fig. 2
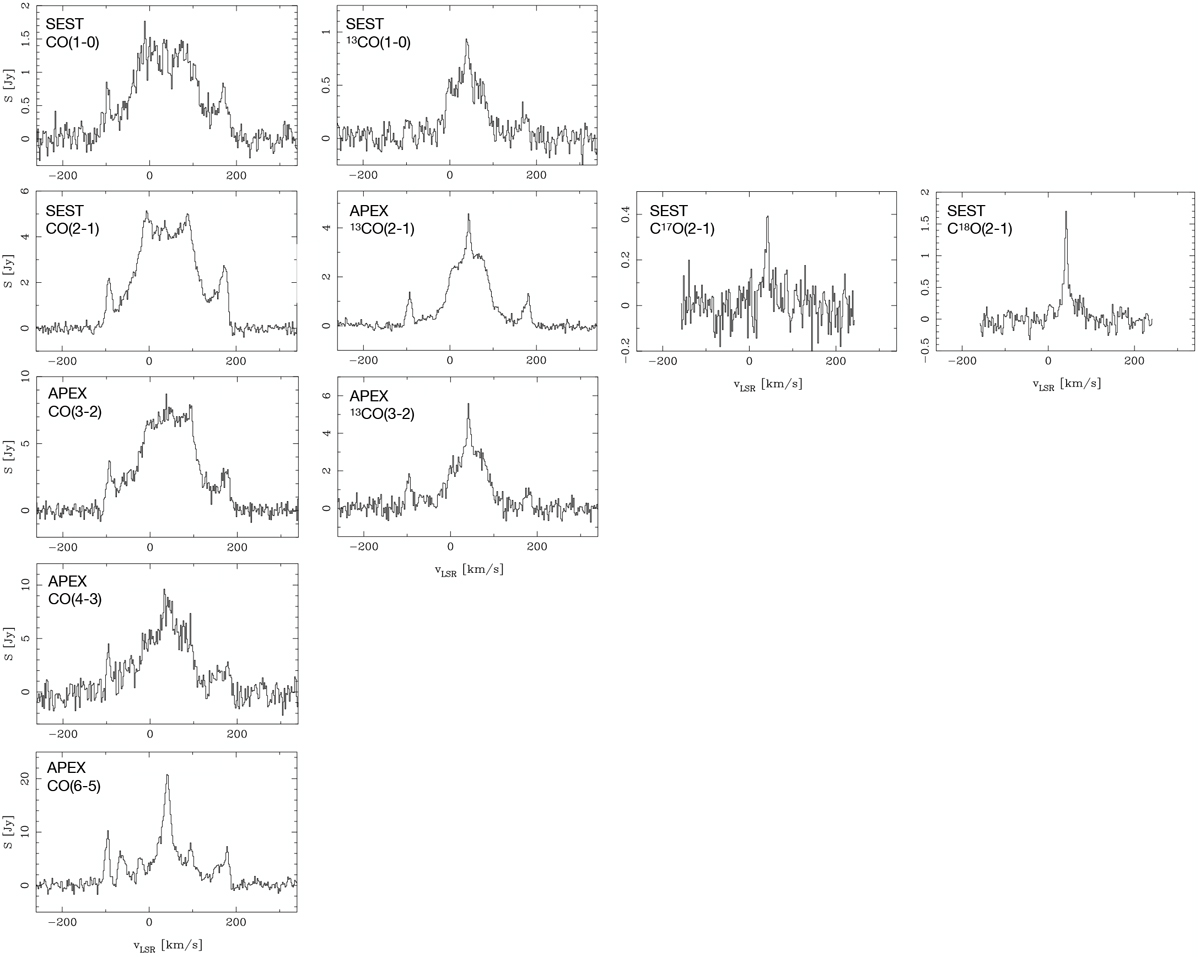
Single-dish CO isotopologue spectra of HD 101584 at 2 km s−1 resolution. Left panels: CO 1–0, 2–1, 3–2, 4–3, and 6–5 spectra from top to bottom. Middle left panel: 13CO 1–0, 2–1, and 3–2 spectra from top to bottom. Middle right panel: C17O 2–1spectrum. Right panel: C18O 2–1spectrum. We note that the emission at the velocity extremes in the CO 4–3 and 6–5 lines my be suppressed by up to ≈20 and 50%, respectively, due to the relative sizes of the source and the beam (the beam is always pointed towards the centre of the source).
Current usage metrics show cumulative count of Article Views (full-text article views including HTML views, PDF and ePub downloads, according to the available data) and Abstracts Views on Vision4Press platform.
Data correspond to usage on the plateform after 2015. The current usage metrics is available 48-96 hours after online publication and is updated daily on week days.
Initial download of the metrics may take a while.