Free Access
Fig. 17
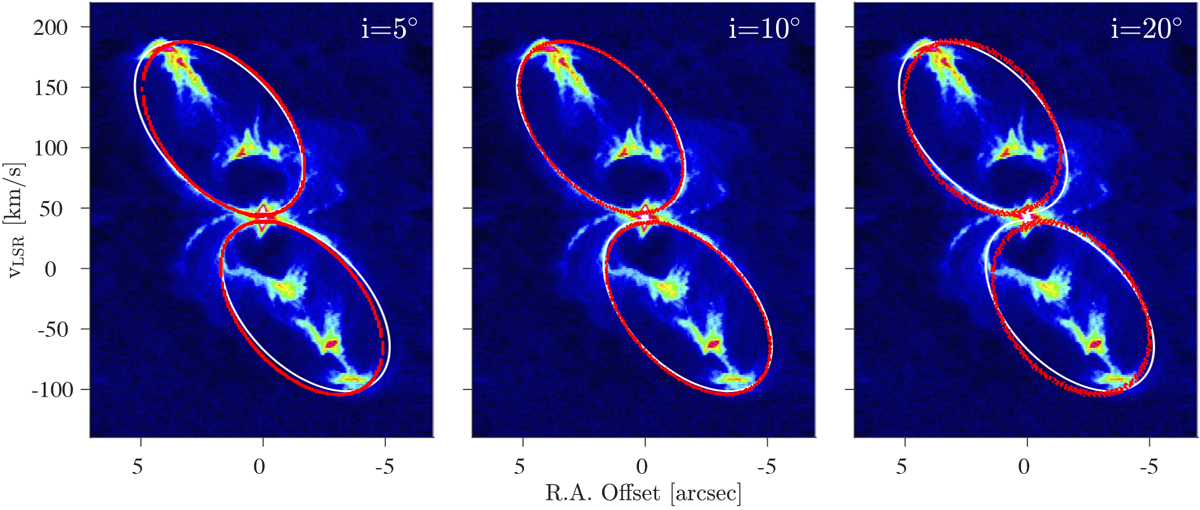
CO(2–1) PV-diagram along PA = 90° with an ellipse fitted to the observational HGS/bubble structure shown in white. Results of the best-fit model (see text for details) for i = 5°, 10°, and 20° are shown as a red solid line.
Current usage metrics show cumulative count of Article Views (full-text article views including HTML views, PDF and ePub downloads, according to the available data) and Abstracts Views on Vision4Press platform.
Data correspond to usage on the plateform after 2015. The current usage metrics is available 48-96 hours after online publication and is updated daily on week days.
Initial download of the metrics may take a while.