Fig. 7.
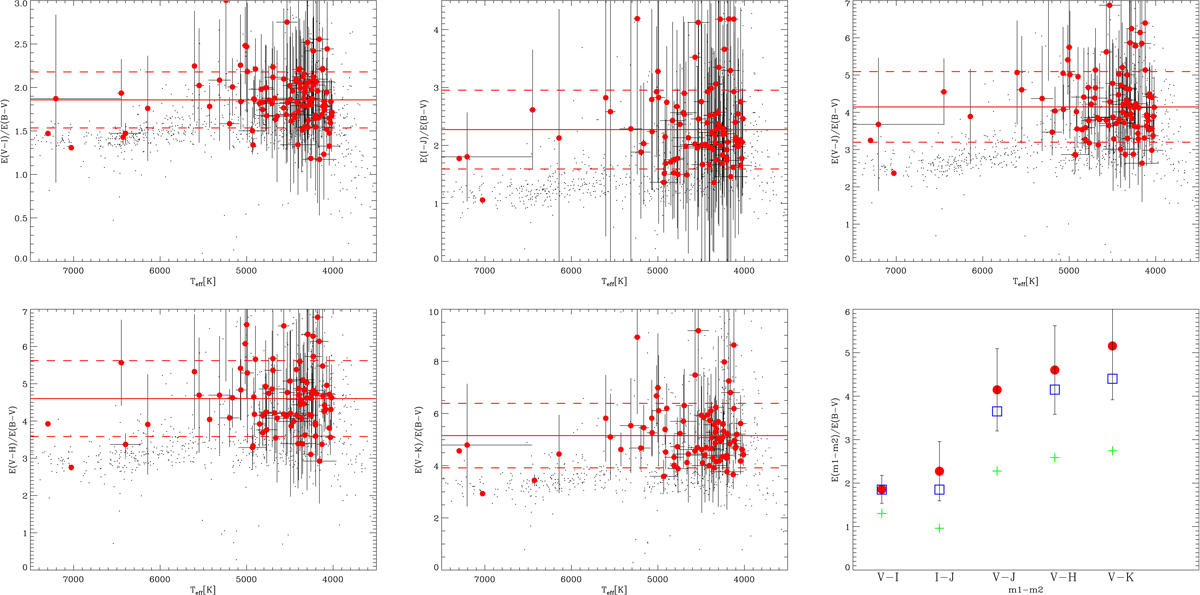
First five panels: ratios of individual reddenings in several combinations of colours as a function of the effective temperatures for all GES targets (small dots) and for WTTSp cluster members with Teff > 4000 K (red points). Lower right panel: mean ratios of reddening values for the WTTSp cluster members in several colours (red circles), compared with the expected analogous values given for RV = 3.1 (green plus symbols) and RV = 5.0 (blue squares) based on the Fiorucci & Munari (2003) relations.
Current usage metrics show cumulative count of Article Views (full-text article views including HTML views, PDF and ePub downloads, according to the available data) and Abstracts Views on Vision4Press platform.
Data correspond to usage on the plateform after 2015. The current usage metrics is available 48-96 hours after online publication and is updated daily on week days.
Initial download of the metrics may take a while.