Fig. 6.
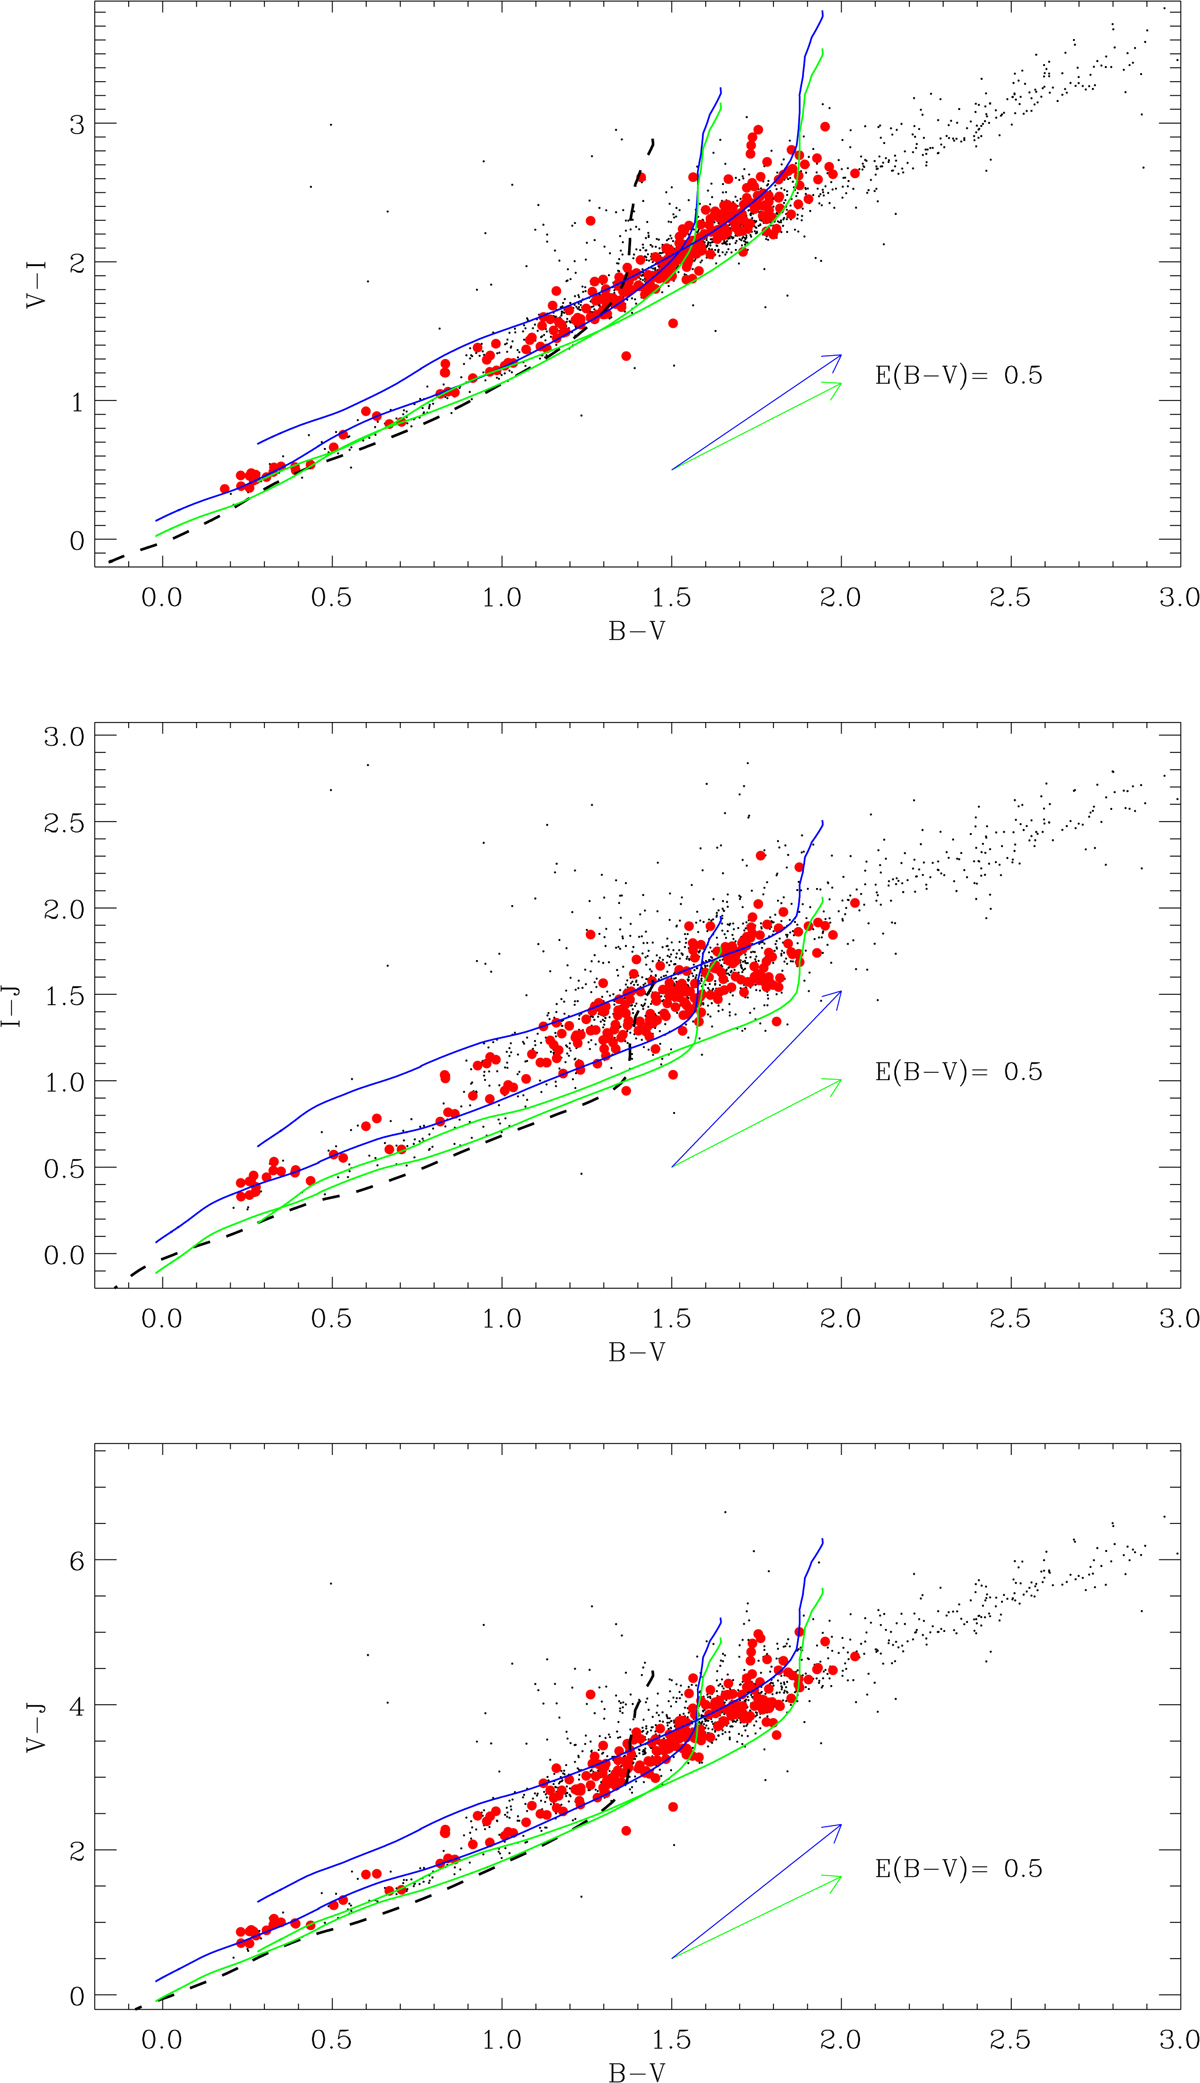
Colour-colour diagrams of the GES targets (black dots) and WTTSp cluster members (red points) for three different sets of colour combinations. The dashed black line is the theoretical colour-colour locus adopted in this work (see Sect. 6). Green and blue solid lines are the same locus reddened by E(B − V) = 0.2 and 0.5 assuming RV = 3.1 and RV = 5.0, respectively.
Current usage metrics show cumulative count of Article Views (full-text article views including HTML views, PDF and ePub downloads, according to the available data) and Abstracts Views on Vision4Press platform.
Data correspond to usage on the plateform after 2015. The current usage metrics is available 48-96 hours after online publication and is updated daily on week days.
Initial download of the metrics may take a while.