Free Access
Fig. 5.
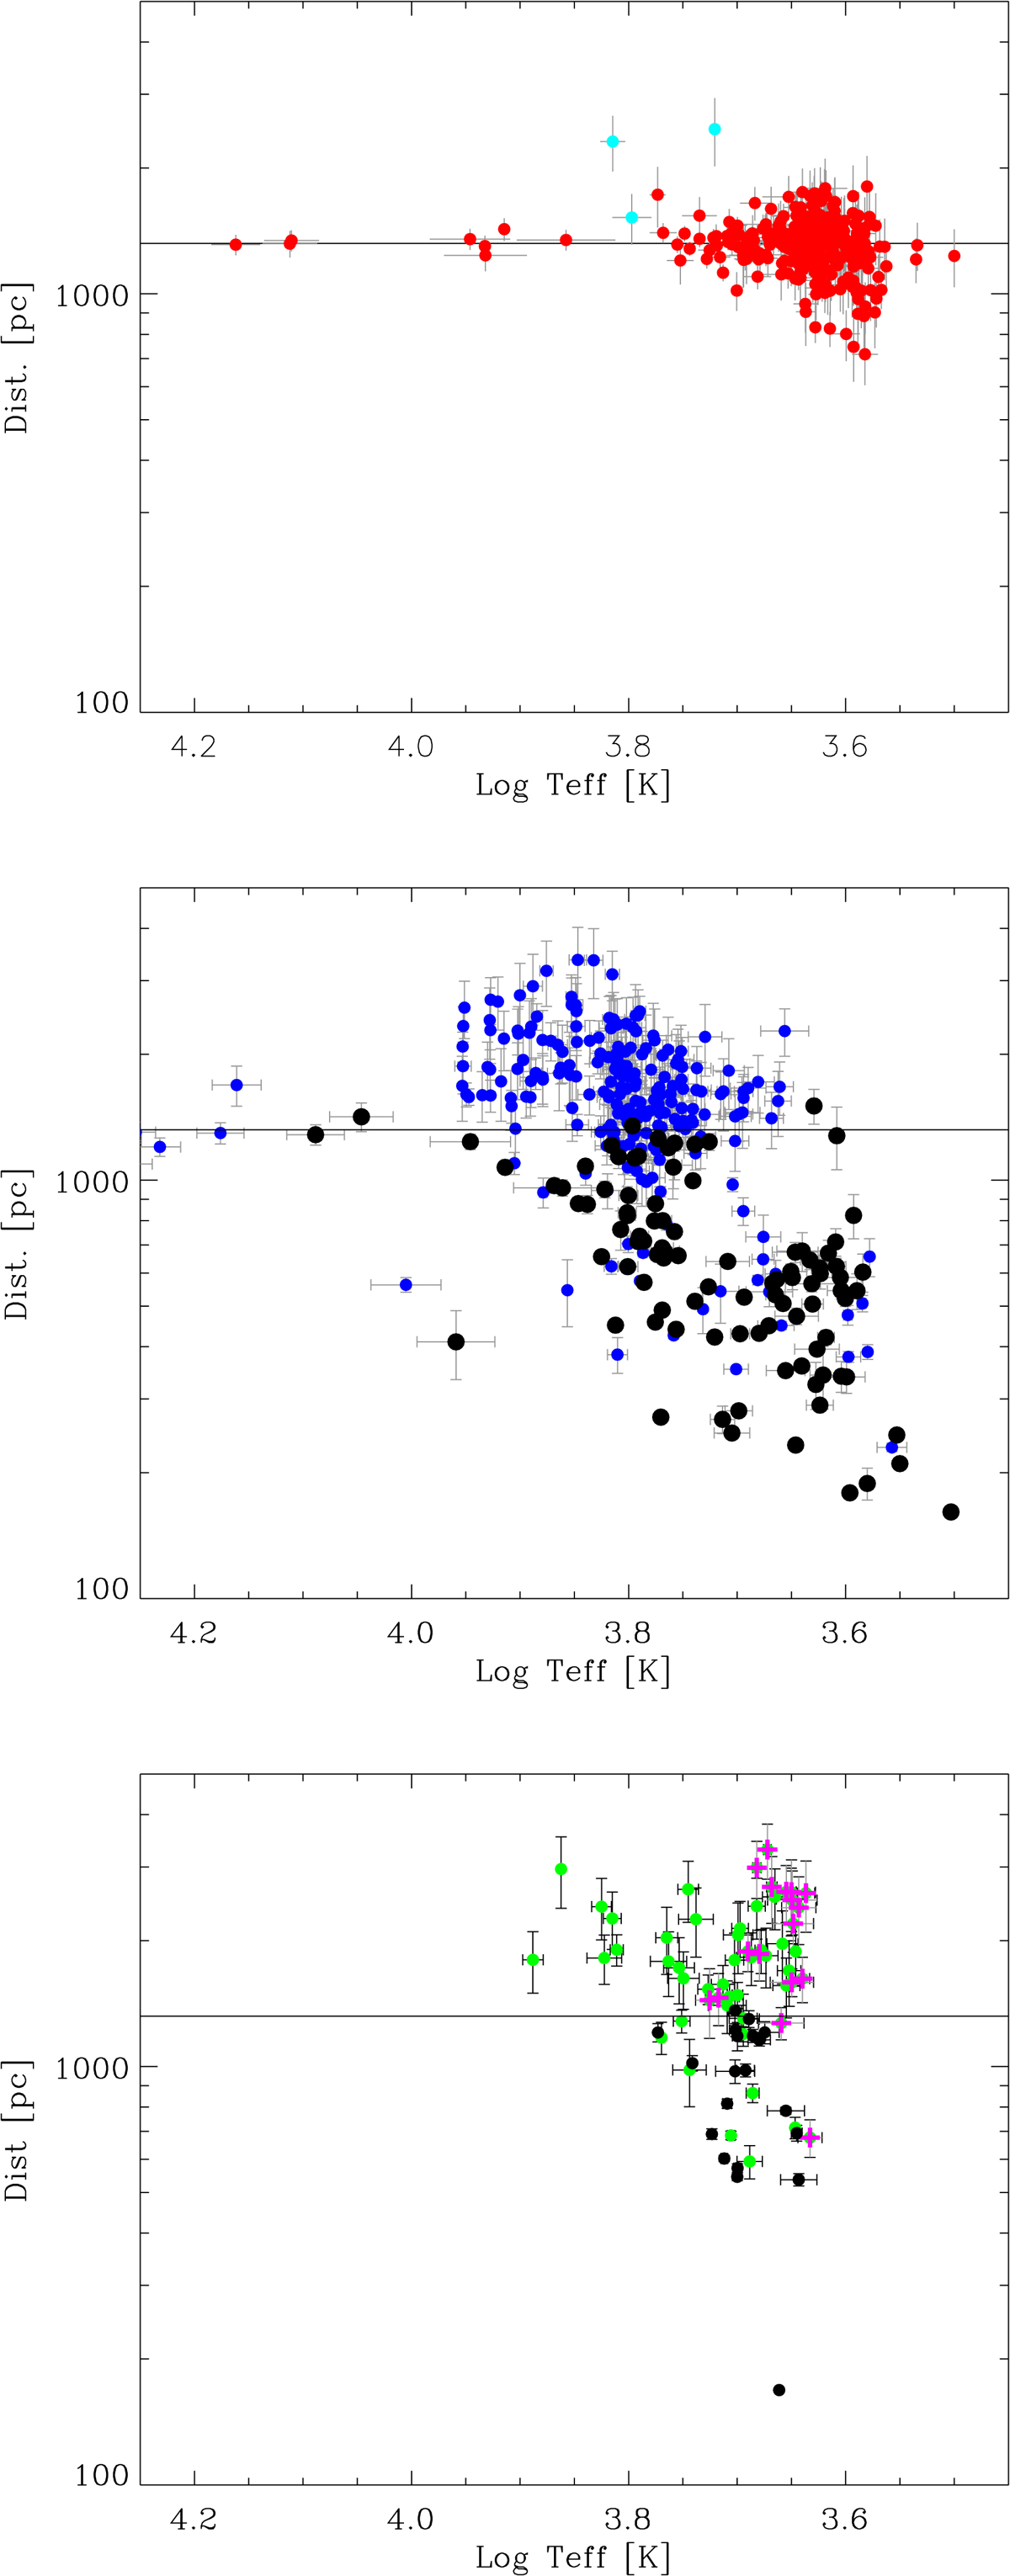
Distances vs. effective temperatures for cluster members, MS, and giant field stars derived using Gaia DR2 data. Symbol colours are indicated as in Fig. 4. The horizontal solid line indicates the cluster distance.
Current usage metrics show cumulative count of Article Views (full-text article views including HTML views, PDF and ePub downloads, according to the available data) and Abstracts Views on Vision4Press platform.
Data correspond to usage on the plateform after 2015. The current usage metrics is available 48-96 hours after online publication and is updated daily on week days.
Initial download of the metrics may take a while.