Fig. 2.
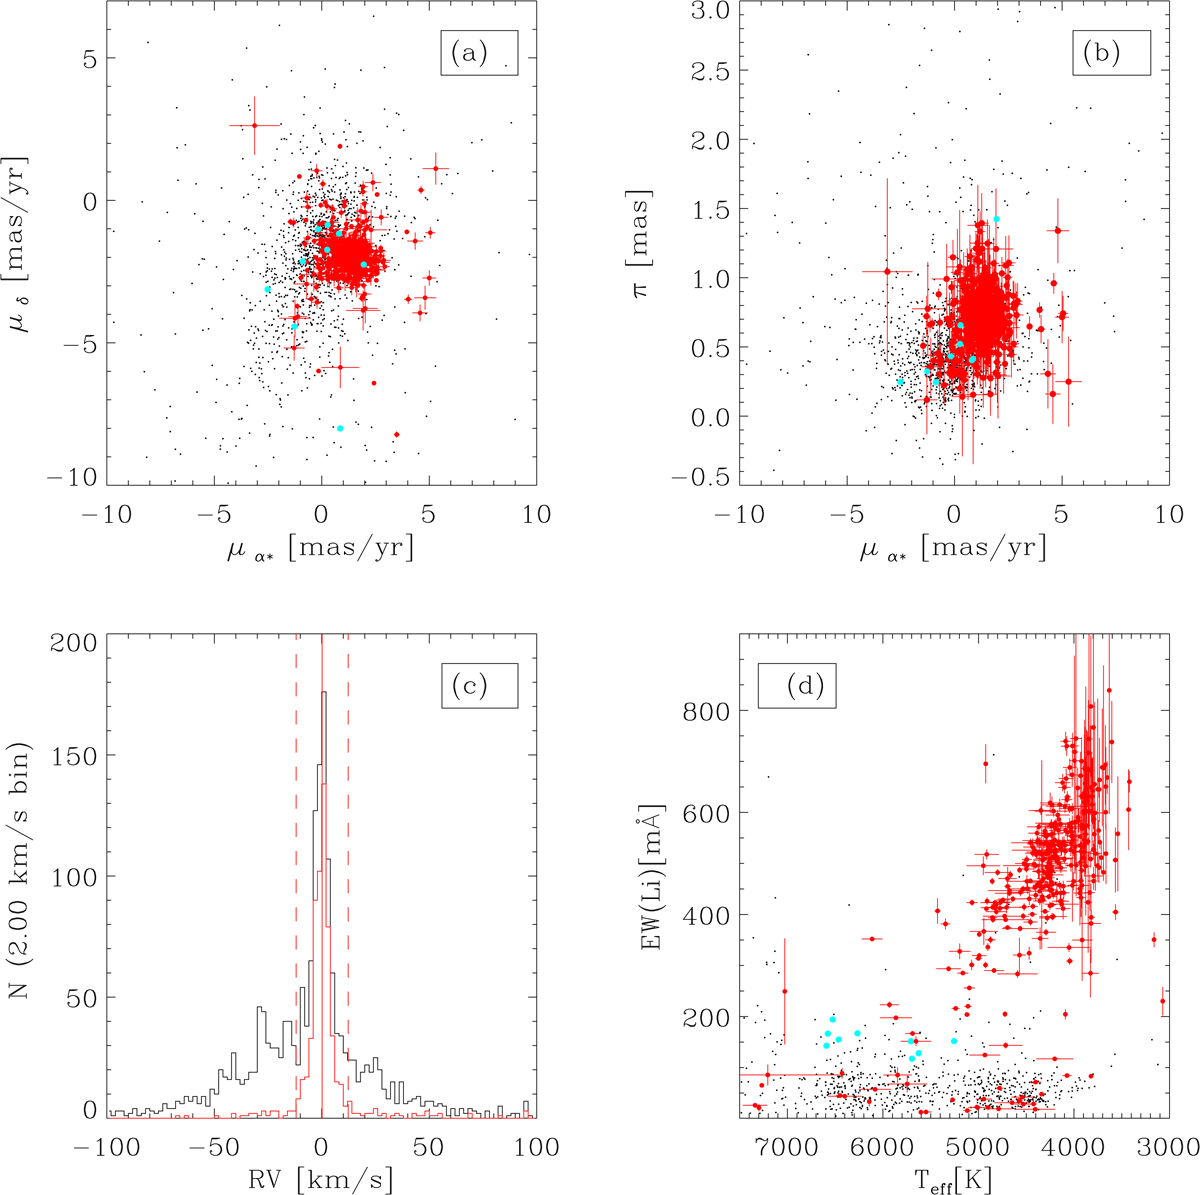
Gaia DR2 proper motion scatter plot (panel a), Gaia DR2 parallaxes vs. μδ (panel b), RV distribution (panel c), and EW(Li) as a function of the effective temperature (panel d) of all GES targets (black symbols). Objects selected as confirmed (probable) cluster members are indicated as red (cyan) dots. The red histogram in panel c is the RV distribution of the confirmed cluster members, while dashed red lines are the limits used for the selection of RV candidate members.
Current usage metrics show cumulative count of Article Views (full-text article views including HTML views, PDF and ePub downloads, according to the available data) and Abstracts Views on Vision4Press platform.
Data correspond to usage on the plateform after 2015. The current usage metrics is available 48-96 hours after online publication and is updated daily on week days.
Initial download of the metrics may take a while.