Free Access
Fig. 12.
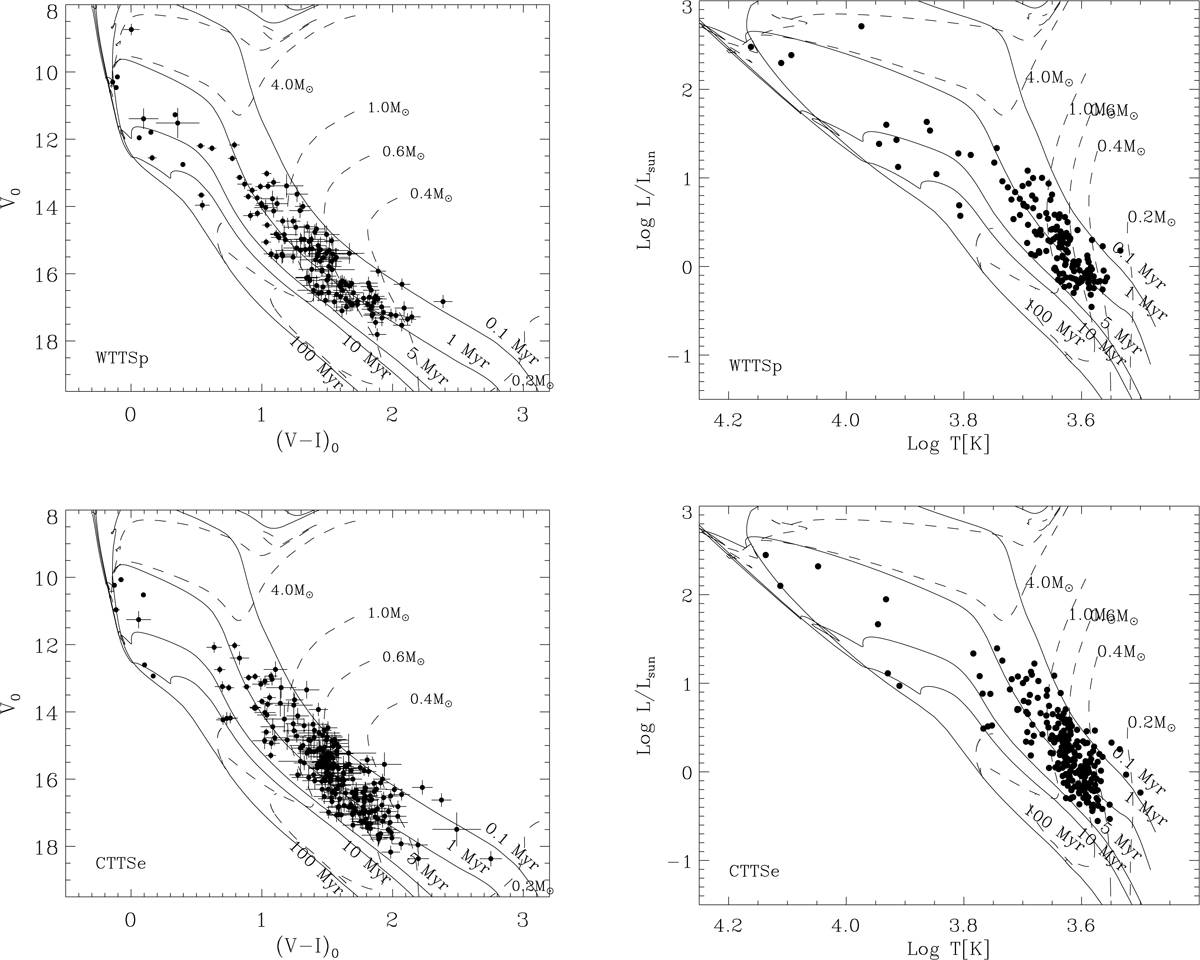
V0 vs. (V − I)0 (left panels) and the HR (right panels) diagrams for members classified as WTTSp (upper panels) and CTTSe (lower panels). The dashed and solid lines indicate the PISA evolutionary tracks and isochrones at masses and ages indicated in each panel and at the cluster distance.
Current usage metrics show cumulative count of Article Views (full-text article views including HTML views, PDF and ePub downloads, according to the available data) and Abstracts Views on Vision4Press platform.
Data correspond to usage on the plateform after 2015. The current usage metrics is available 48-96 hours after online publication and is updated daily on week days.
Initial download of the metrics may take a while.