Fig. 10.
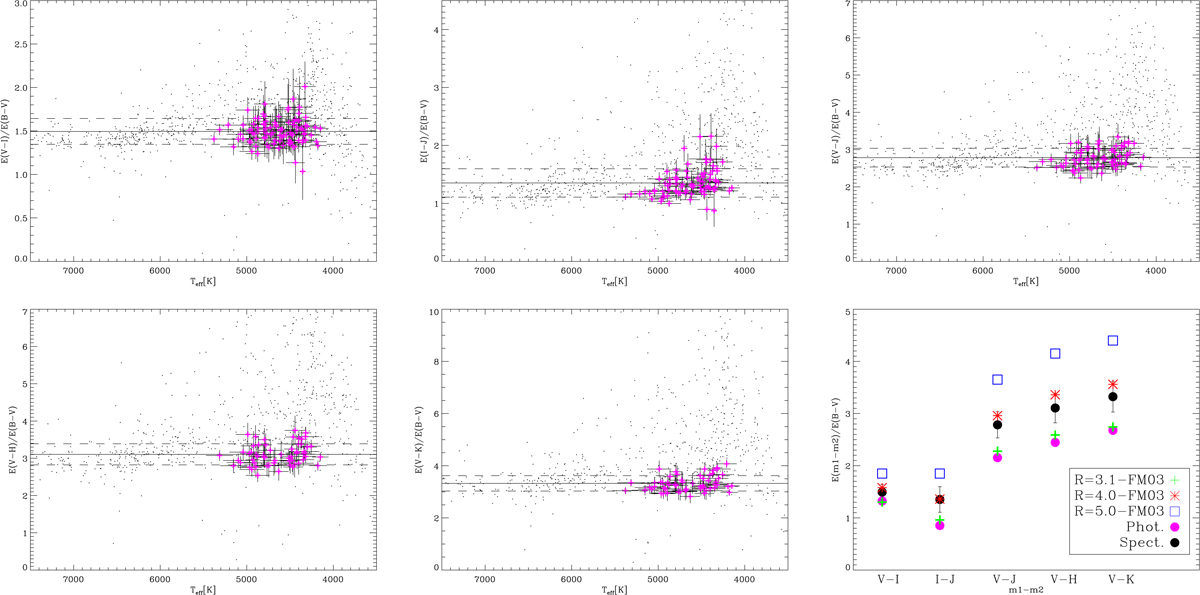
First five panels: reddening ratios in several colours over E(B − V) for all GES targets. The RC giants are indicated with magenta plus symbols. The black (dashed) solid line is the mean (standard deviation) obtained for RC giants. Lower right panel: comparison of the slopes obtained from the photometric and spectroscopic data with those given in the literature for various reddening laws.
Current usage metrics show cumulative count of Article Views (full-text article views including HTML views, PDF and ePub downloads, according to the available data) and Abstracts Views on Vision4Press platform.
Data correspond to usage on the plateform after 2015. The current usage metrics is available 48-96 hours after online publication and is updated daily on week days.
Initial download of the metrics may take a while.