Free Access
Fig. 7.
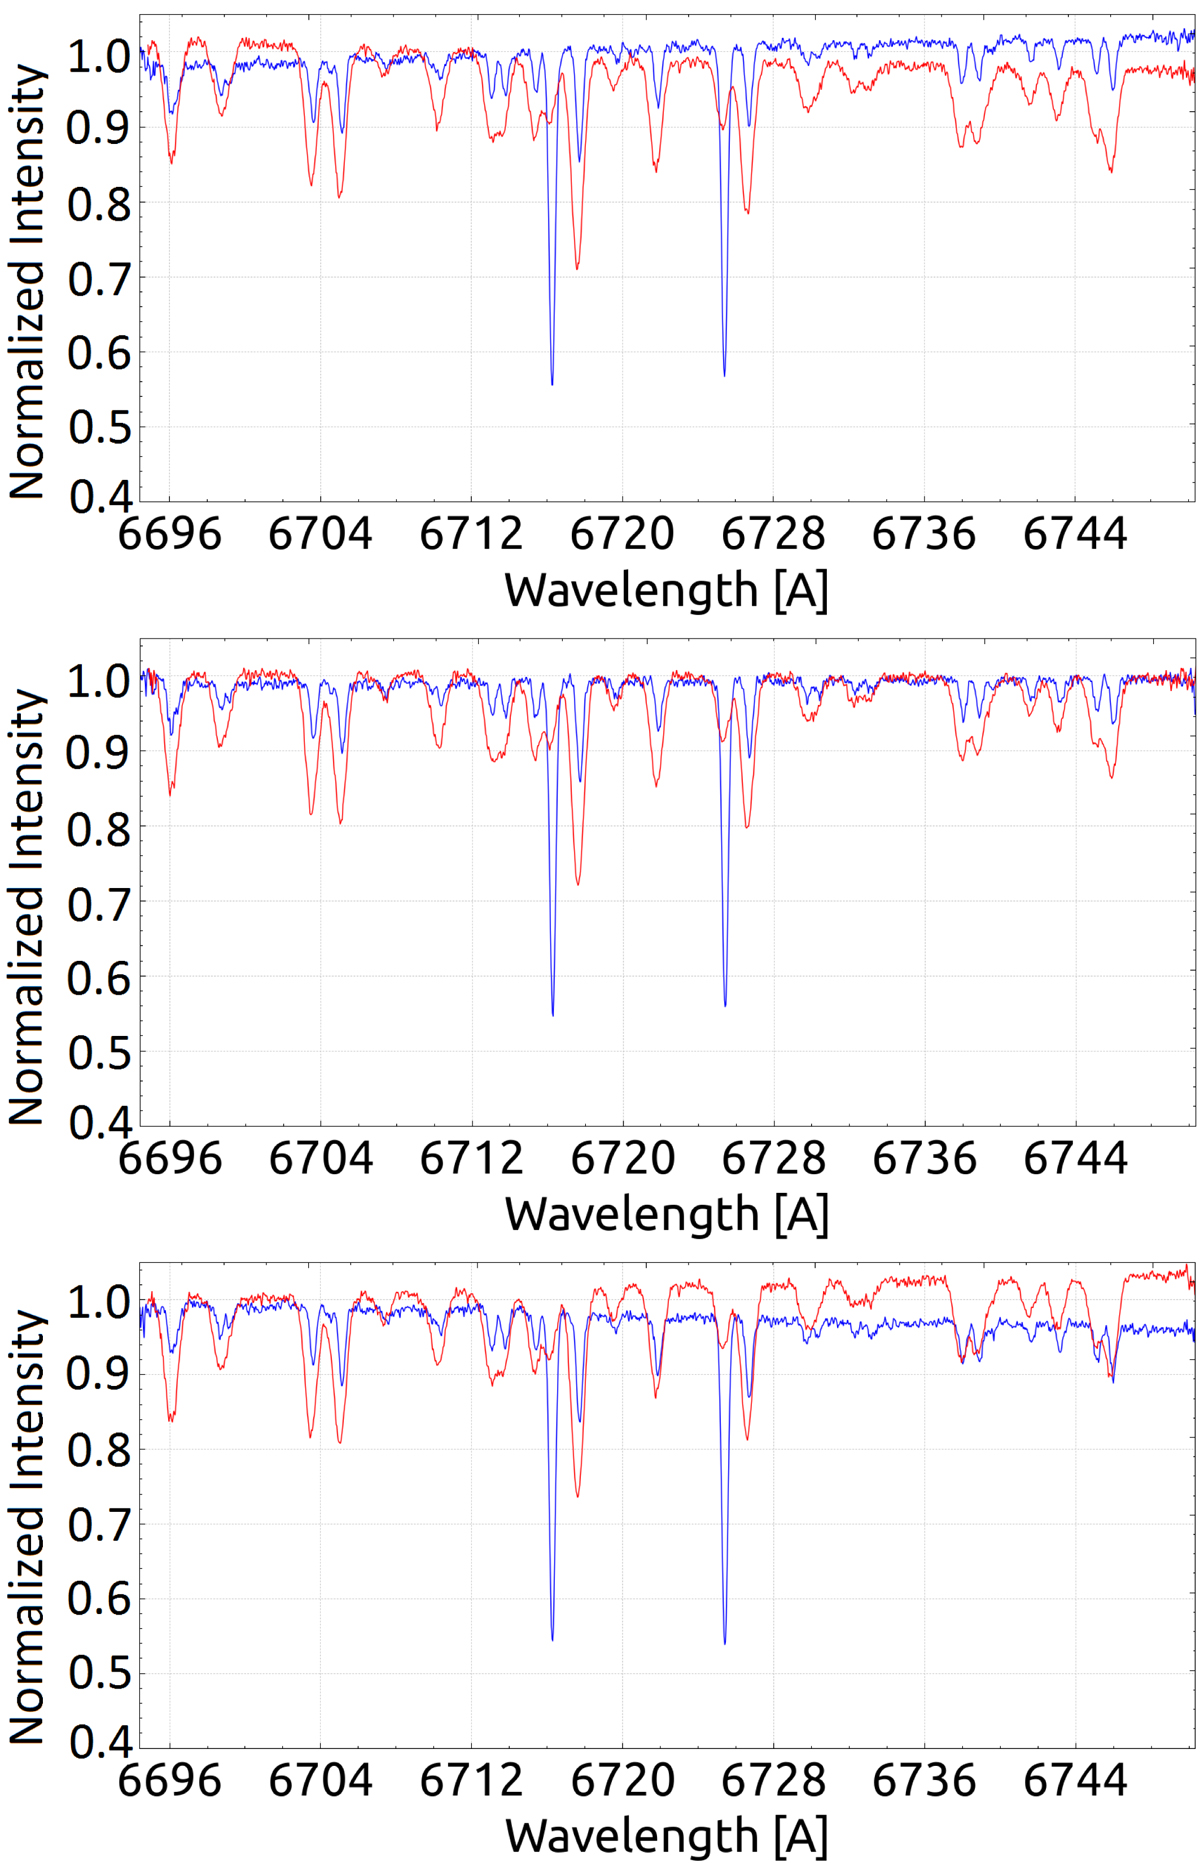
Results from disentangled artificial spectra (time series of 20) showing a flare at phase 0.25 (bottom), 0.50 (centre), and 0.75 (top). The sign of the slope introduced in the results changes at the middle of such an equidistantly spread data set.
Current usage metrics show cumulative count of Article Views (full-text article views including HTML views, PDF and ePub downloads, according to the available data) and Abstracts Views on Vision4Press platform.
Data correspond to usage on the plateform after 2015. The current usage metrics is available 48-96 hours after online publication and is updated daily on week days.
Initial download of the metrics may take a while.