Free Access
Fig. 6.
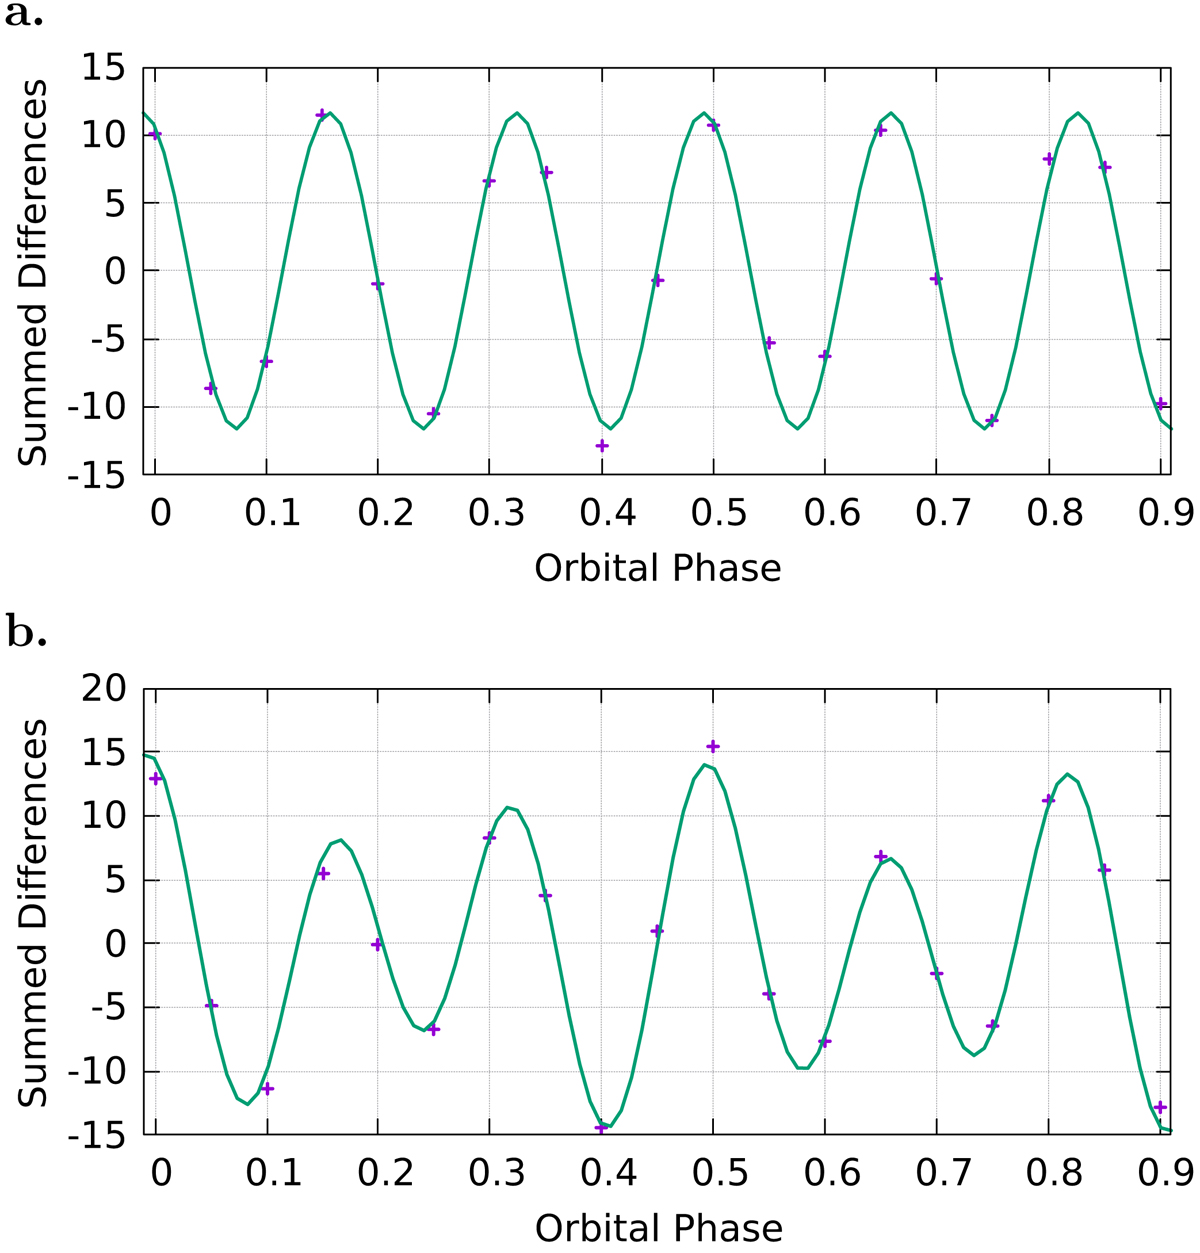
Summed differences (crosses) and sin-fit (green line) vs orbital phase for the artificial SB2 data. Panel a: with primary amplitude of pulsation of 2 km s−1 to extract the pulsational period. Panel b: with amplitude of pulsation for the primary and secondary of 2 km s−1 and 1 km s−1, respectively.
Current usage metrics show cumulative count of Article Views (full-text article views including HTML views, PDF and ePub downloads, according to the available data) and Abstracts Views on Vision4Press platform.
Data correspond to usage on the plateform after 2015. The current usage metrics is available 48-96 hours after online publication and is updated daily on week days.
Initial download of the metrics may take a while.