Fig. 15.
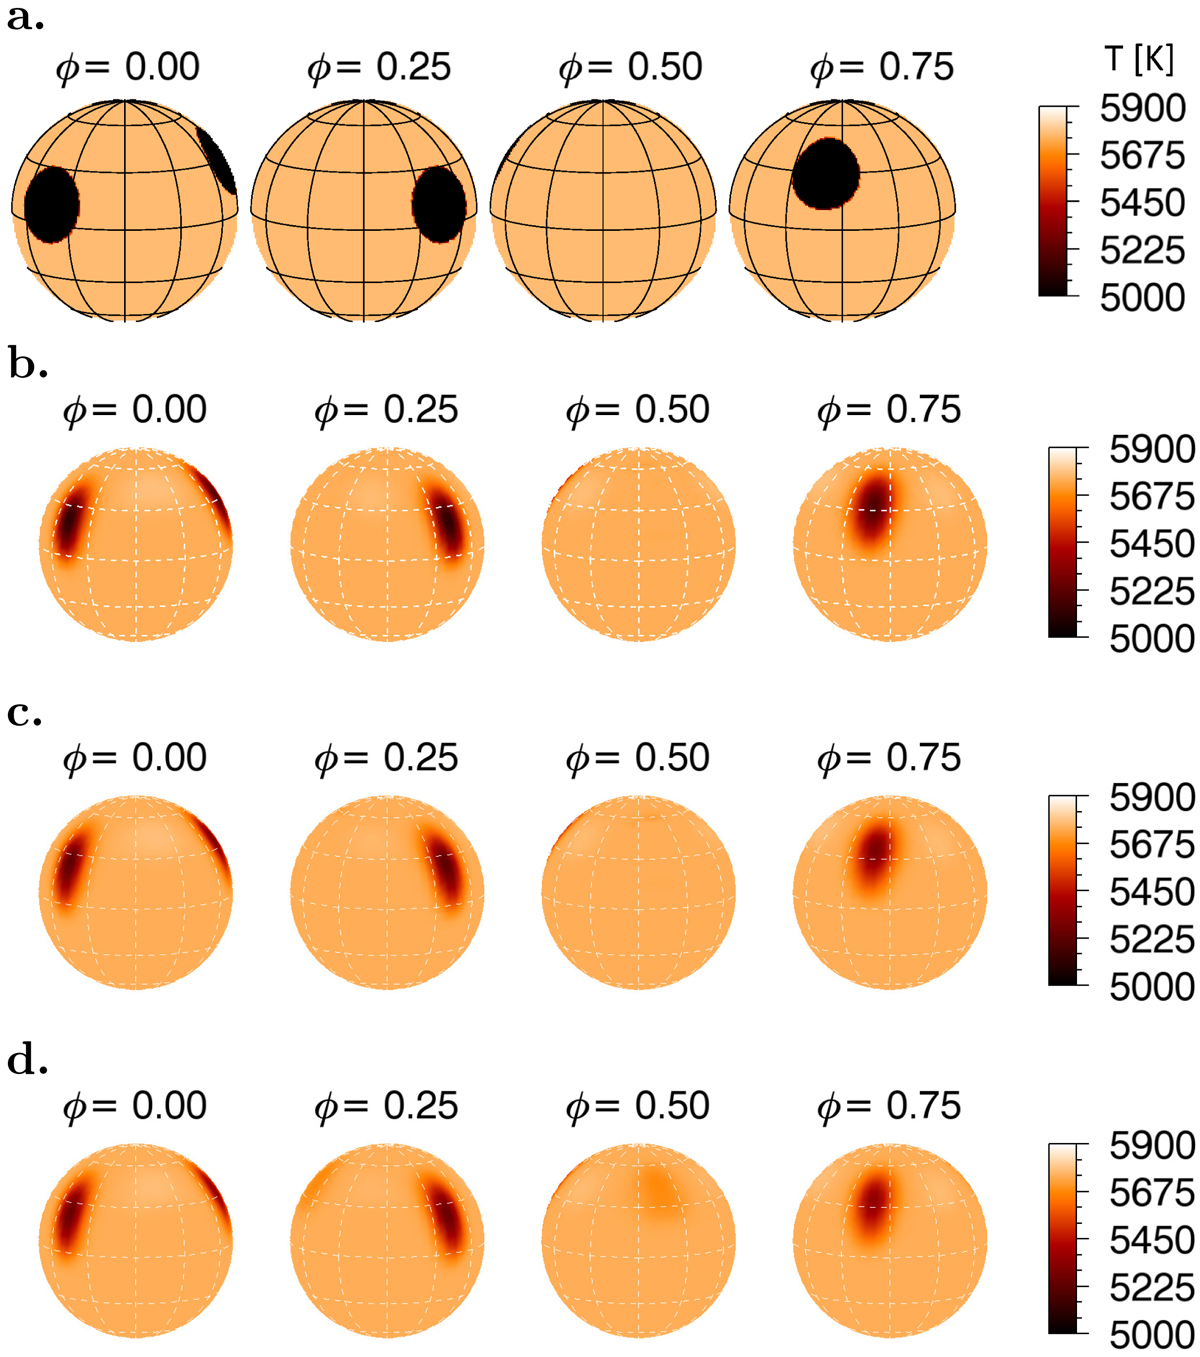
Panel a: input map used to create artificial spot spectra shown from four different viewing angles. Panel b: surface map using the artificial spot spectra without a second component. Panel c: resulting surface map from the artificial spot data after subtraction of disentangled spectra. Panel d: as panel c, but with RVs to align the spectra obtained by CC and manually adjusted.
Current usage metrics show cumulative count of Article Views (full-text article views including HTML views, PDF and ePub downloads, according to the available data) and Abstracts Views on Vision4Press platform.
Data correspond to usage on the plateform after 2015. The current usage metrics is available 48-96 hours after online publication and is updated daily on week days.
Initial download of the metrics may take a while.