Fig. 13.
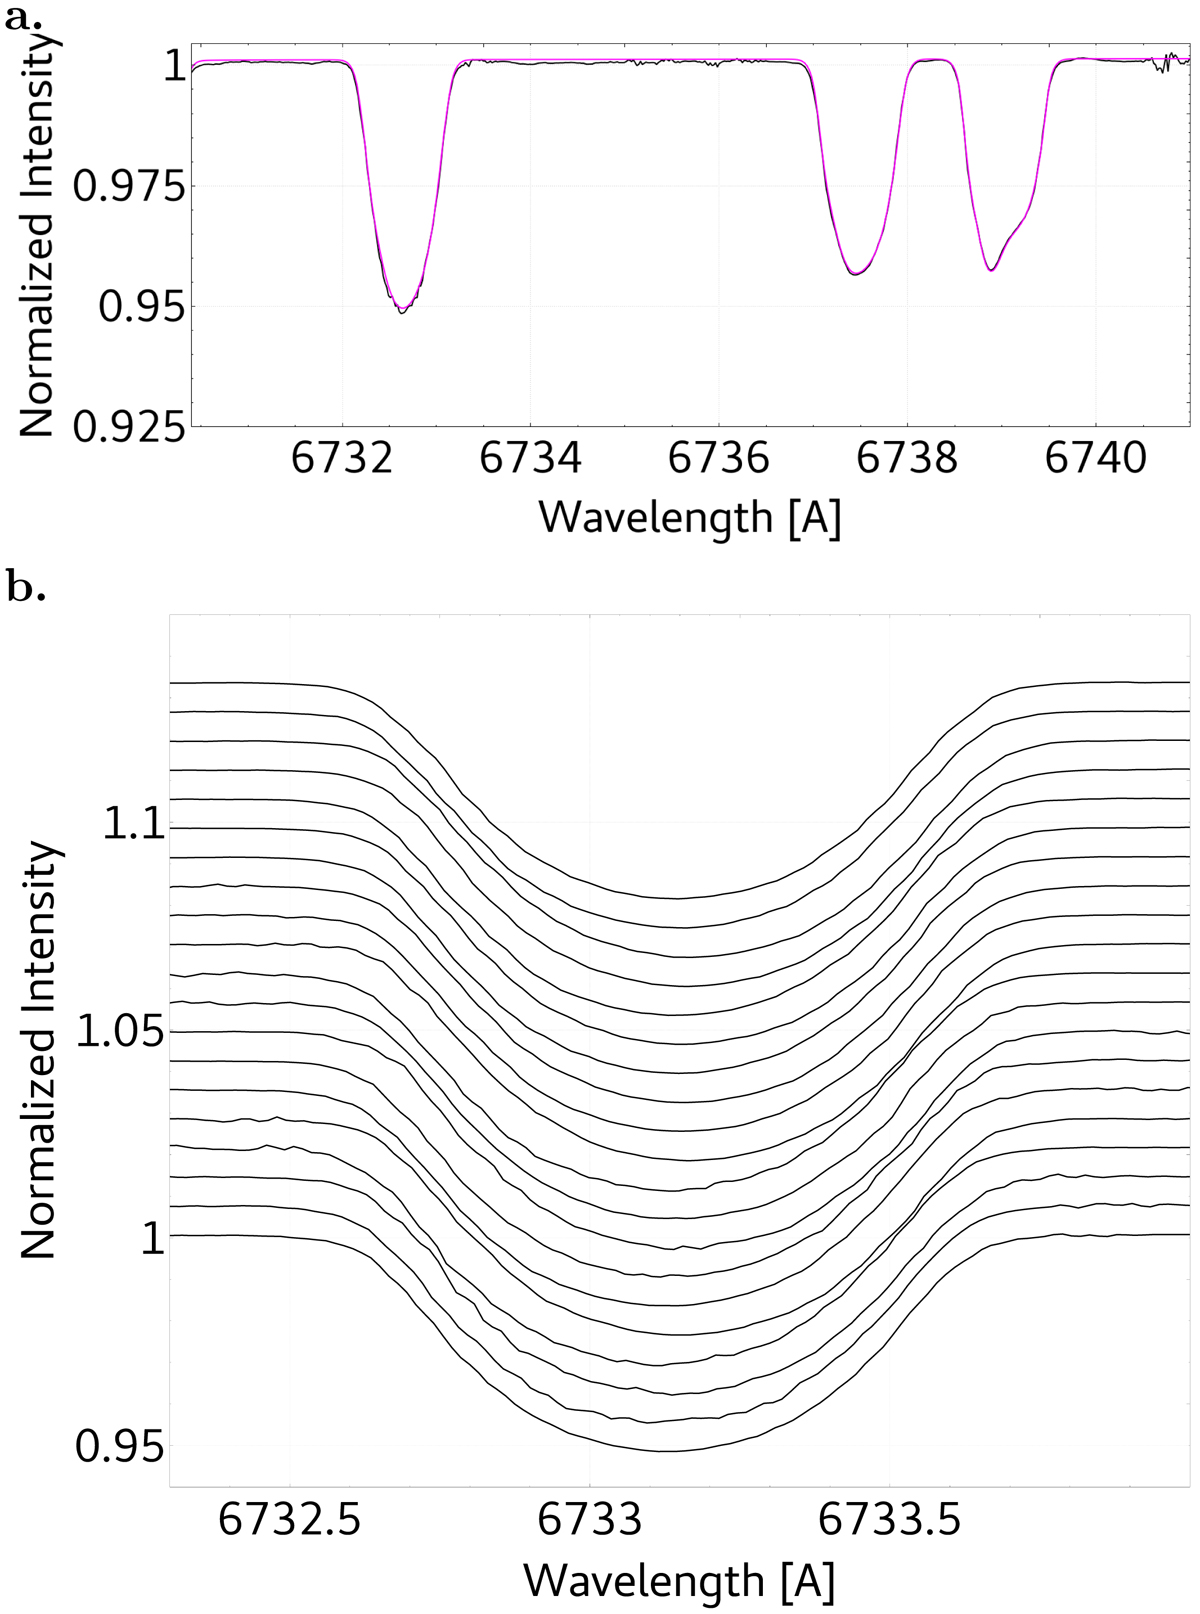
Panel a: zoom-in of three lines of the spectra shown in Fig. 12b. Purple is the input spectra of the spotted component, black the spectra of the spotted component after subtraction of the disentangled non-spotted component used to calculate the map in Fig. 15c. Panel b: zoom-in of the leftmost line from panel a, but for all the spectra used to construct the maps.
Current usage metrics show cumulative count of Article Views (full-text article views including HTML views, PDF and ePub downloads, according to the available data) and Abstracts Views on Vision4Press platform.
Data correspond to usage on the plateform after 2015. The current usage metrics is available 48-96 hours after online publication and is updated daily on week days.
Initial download of the metrics may take a while.